Orcasound lab: a soundscape analysis case study in killer whale habitat with implications for coastal ocean observatories
Val Veirs and Scott Veirs, Beam Reach (SPC), Seattle, WA
Lauren McWhinnie, Patrick O’Hara, & Gregory O’Hagan, NEMES/U.Vic, Victoria, BC
Victoria ASA meeting, Nov 9, 2018
(NEMES = Noise Exposure to the Marine Environment from Ships)
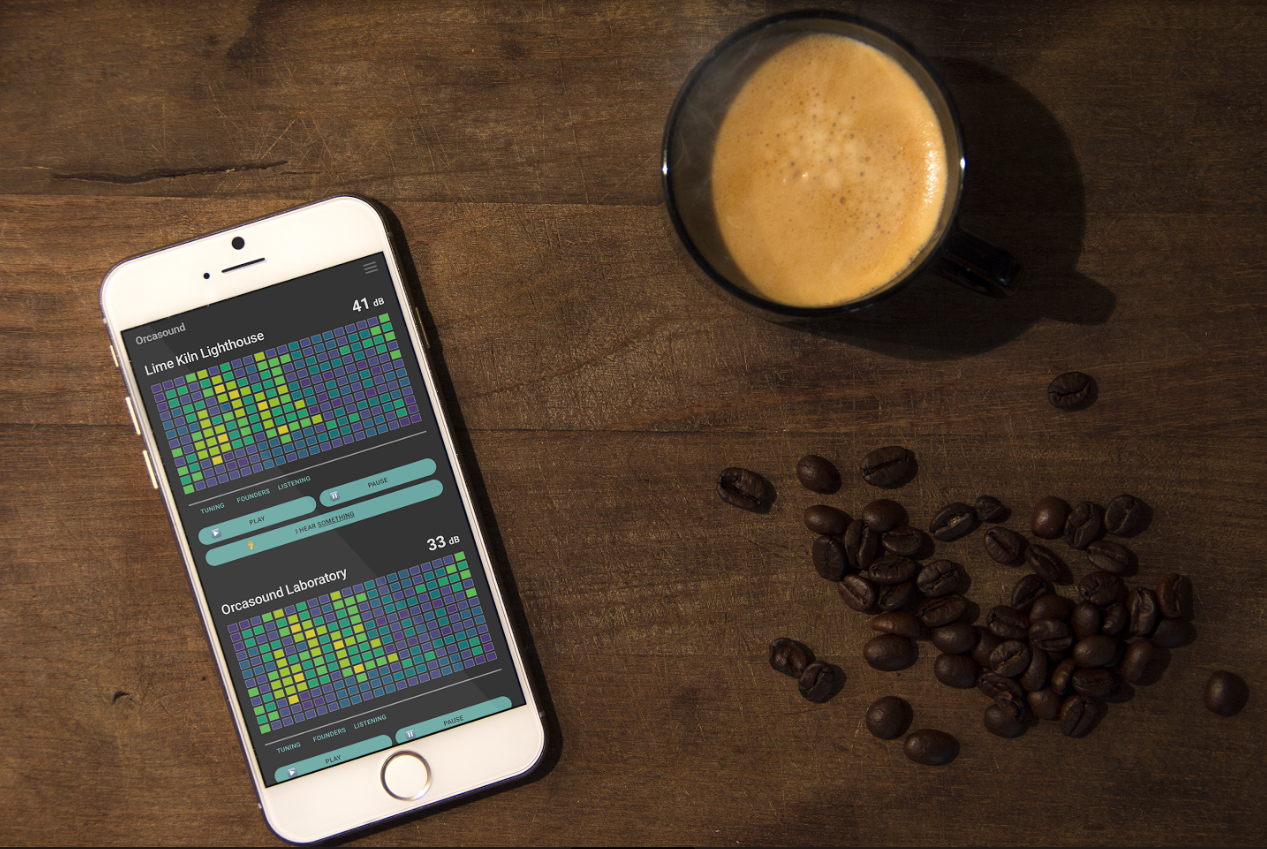
Orcasound app and Orcasound Lab
|
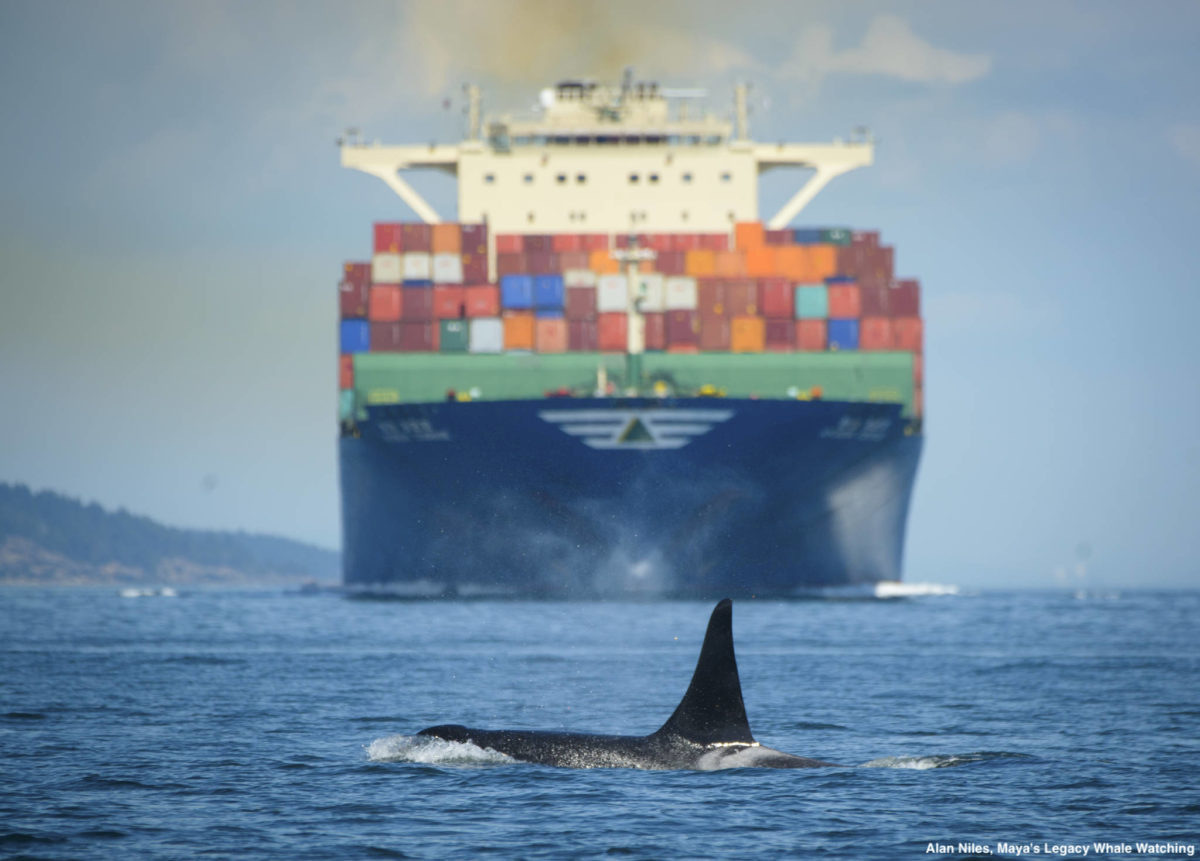
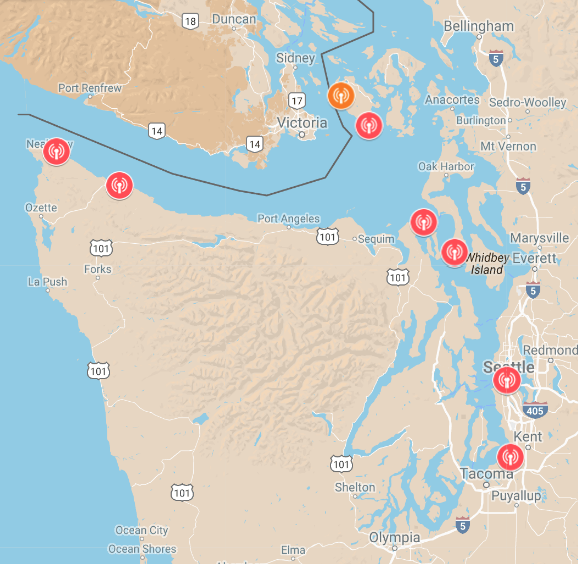
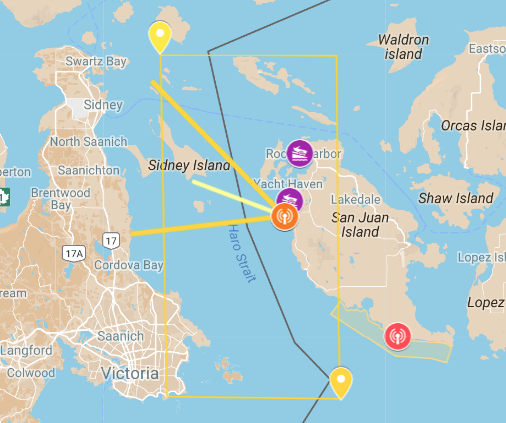
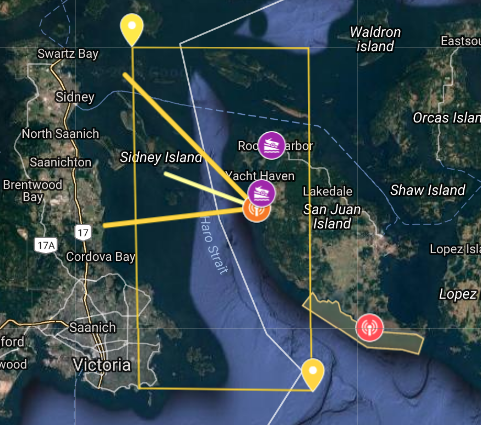
Our study site:
|
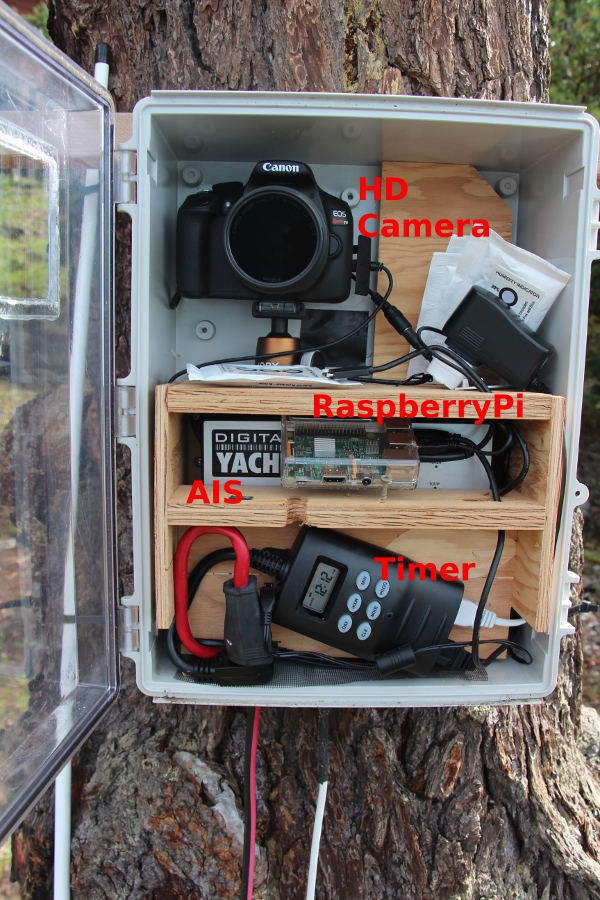
Acoustic data and methods
One year of underwater noise recordings (11/2016 - 11/2017)
 |
Automatic Information System (AIS) data |
2017 vessel behavior and noise study
Collaboration with NEMES
 |
|
 |
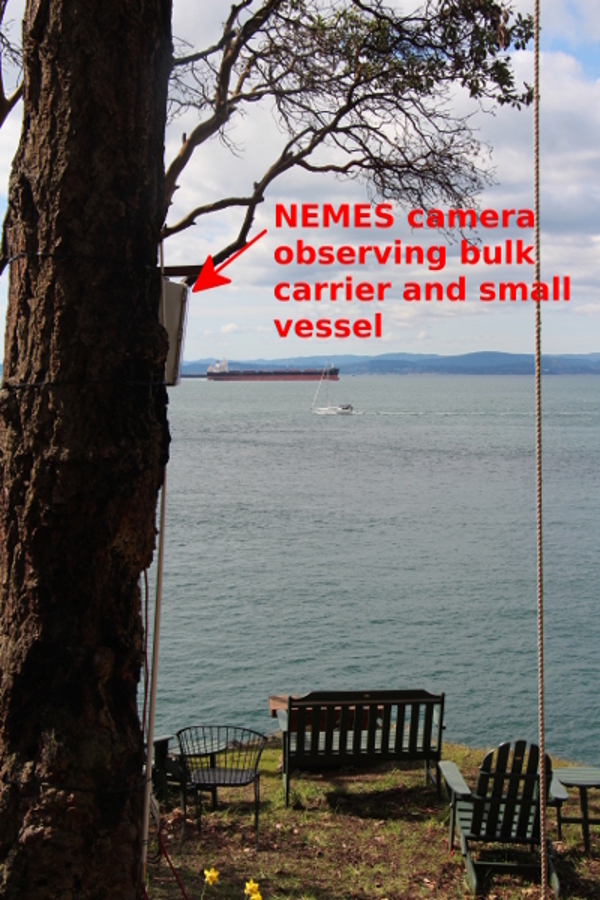
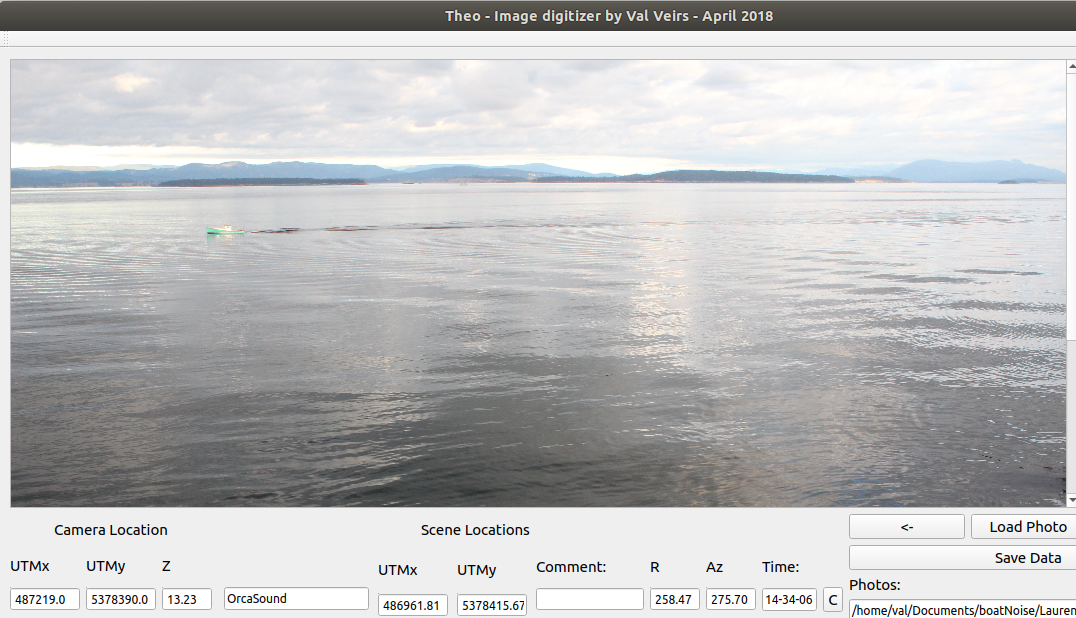
NEMES camera methods:
Measure range, speed, & received levels of boats
- Locate boat in each frame with Theo (custom QT program)
- Compute time of closest point of approach (CPA)
- Compare with time of acoustic peak(s)
 |
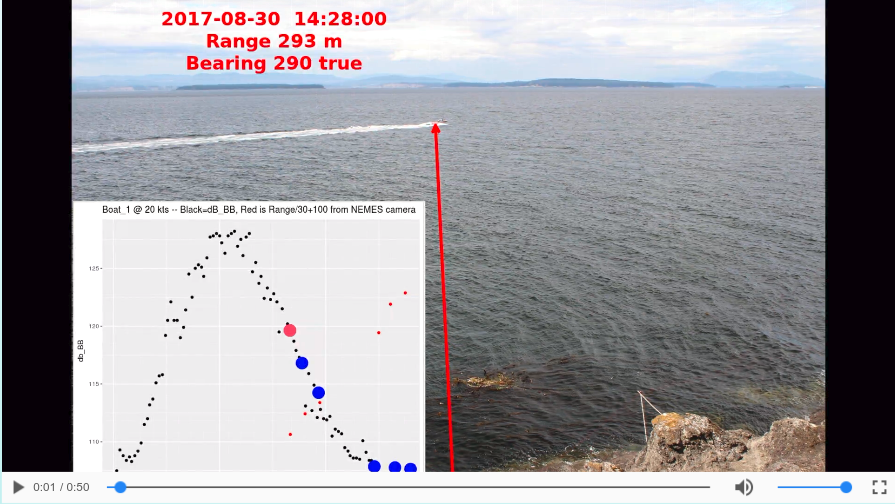 |
Video: NEMES images of 20-kt boat with computed range determining source level
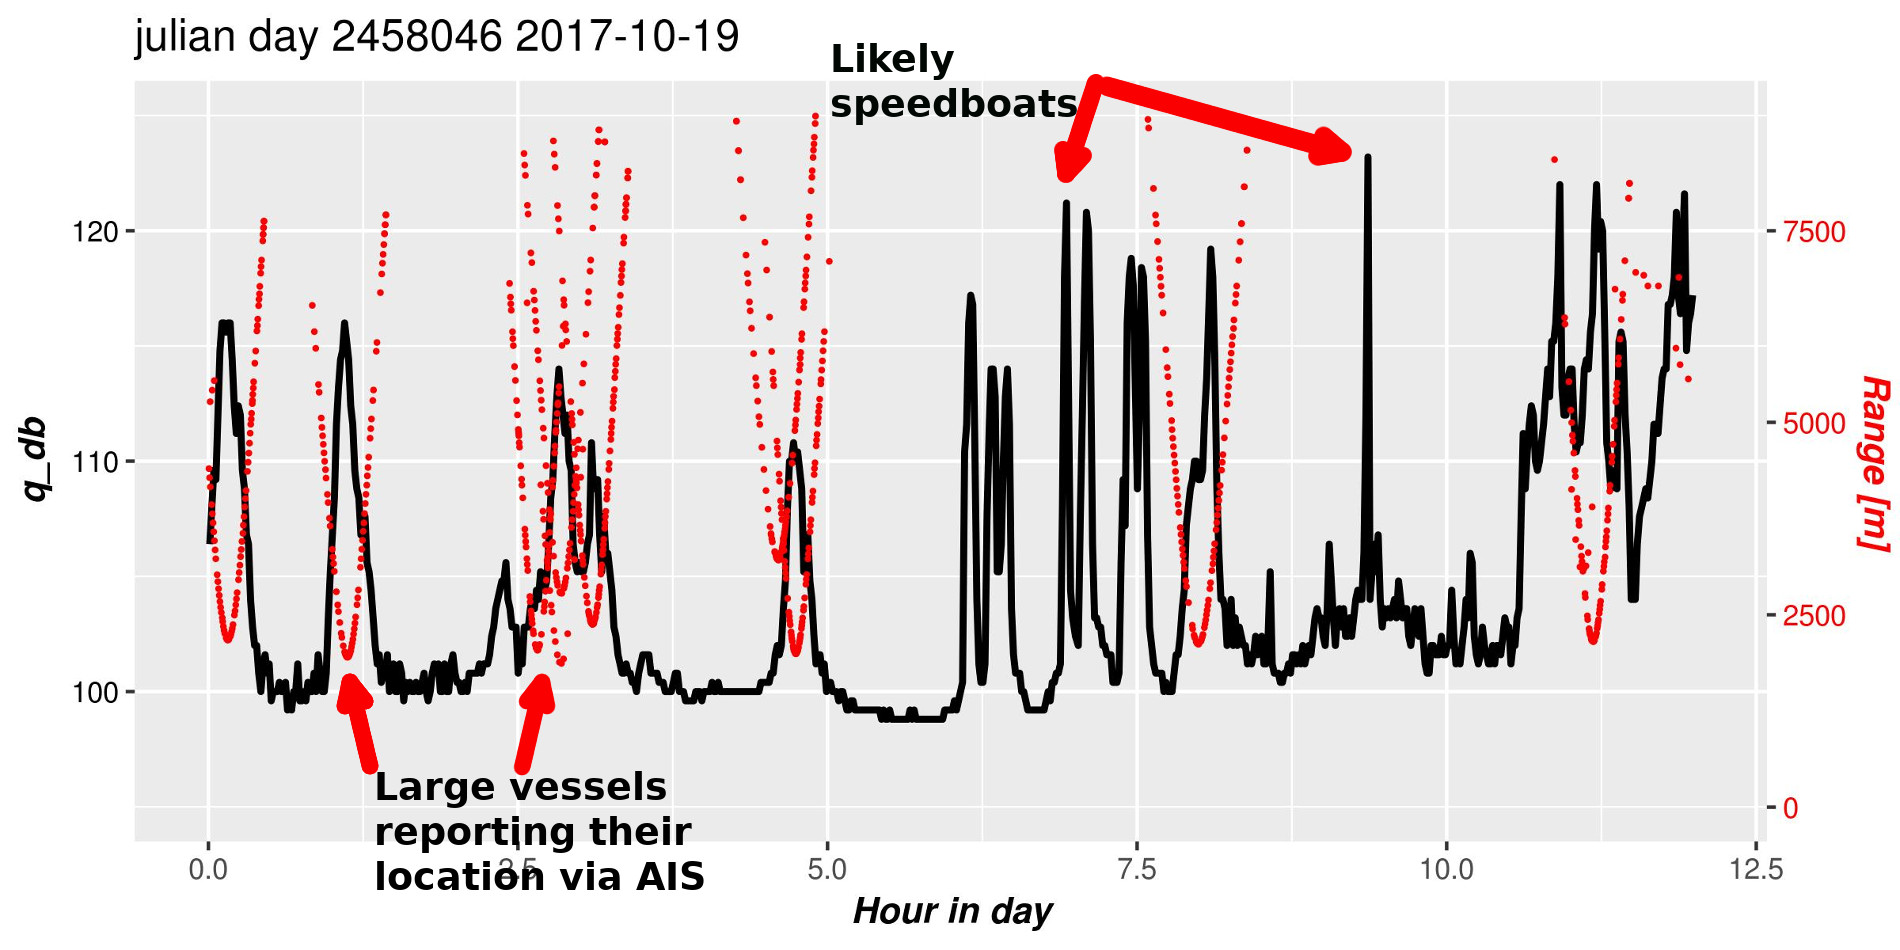
Broadband received level peaks
Ships and boats have similar maxima, but ships last longer
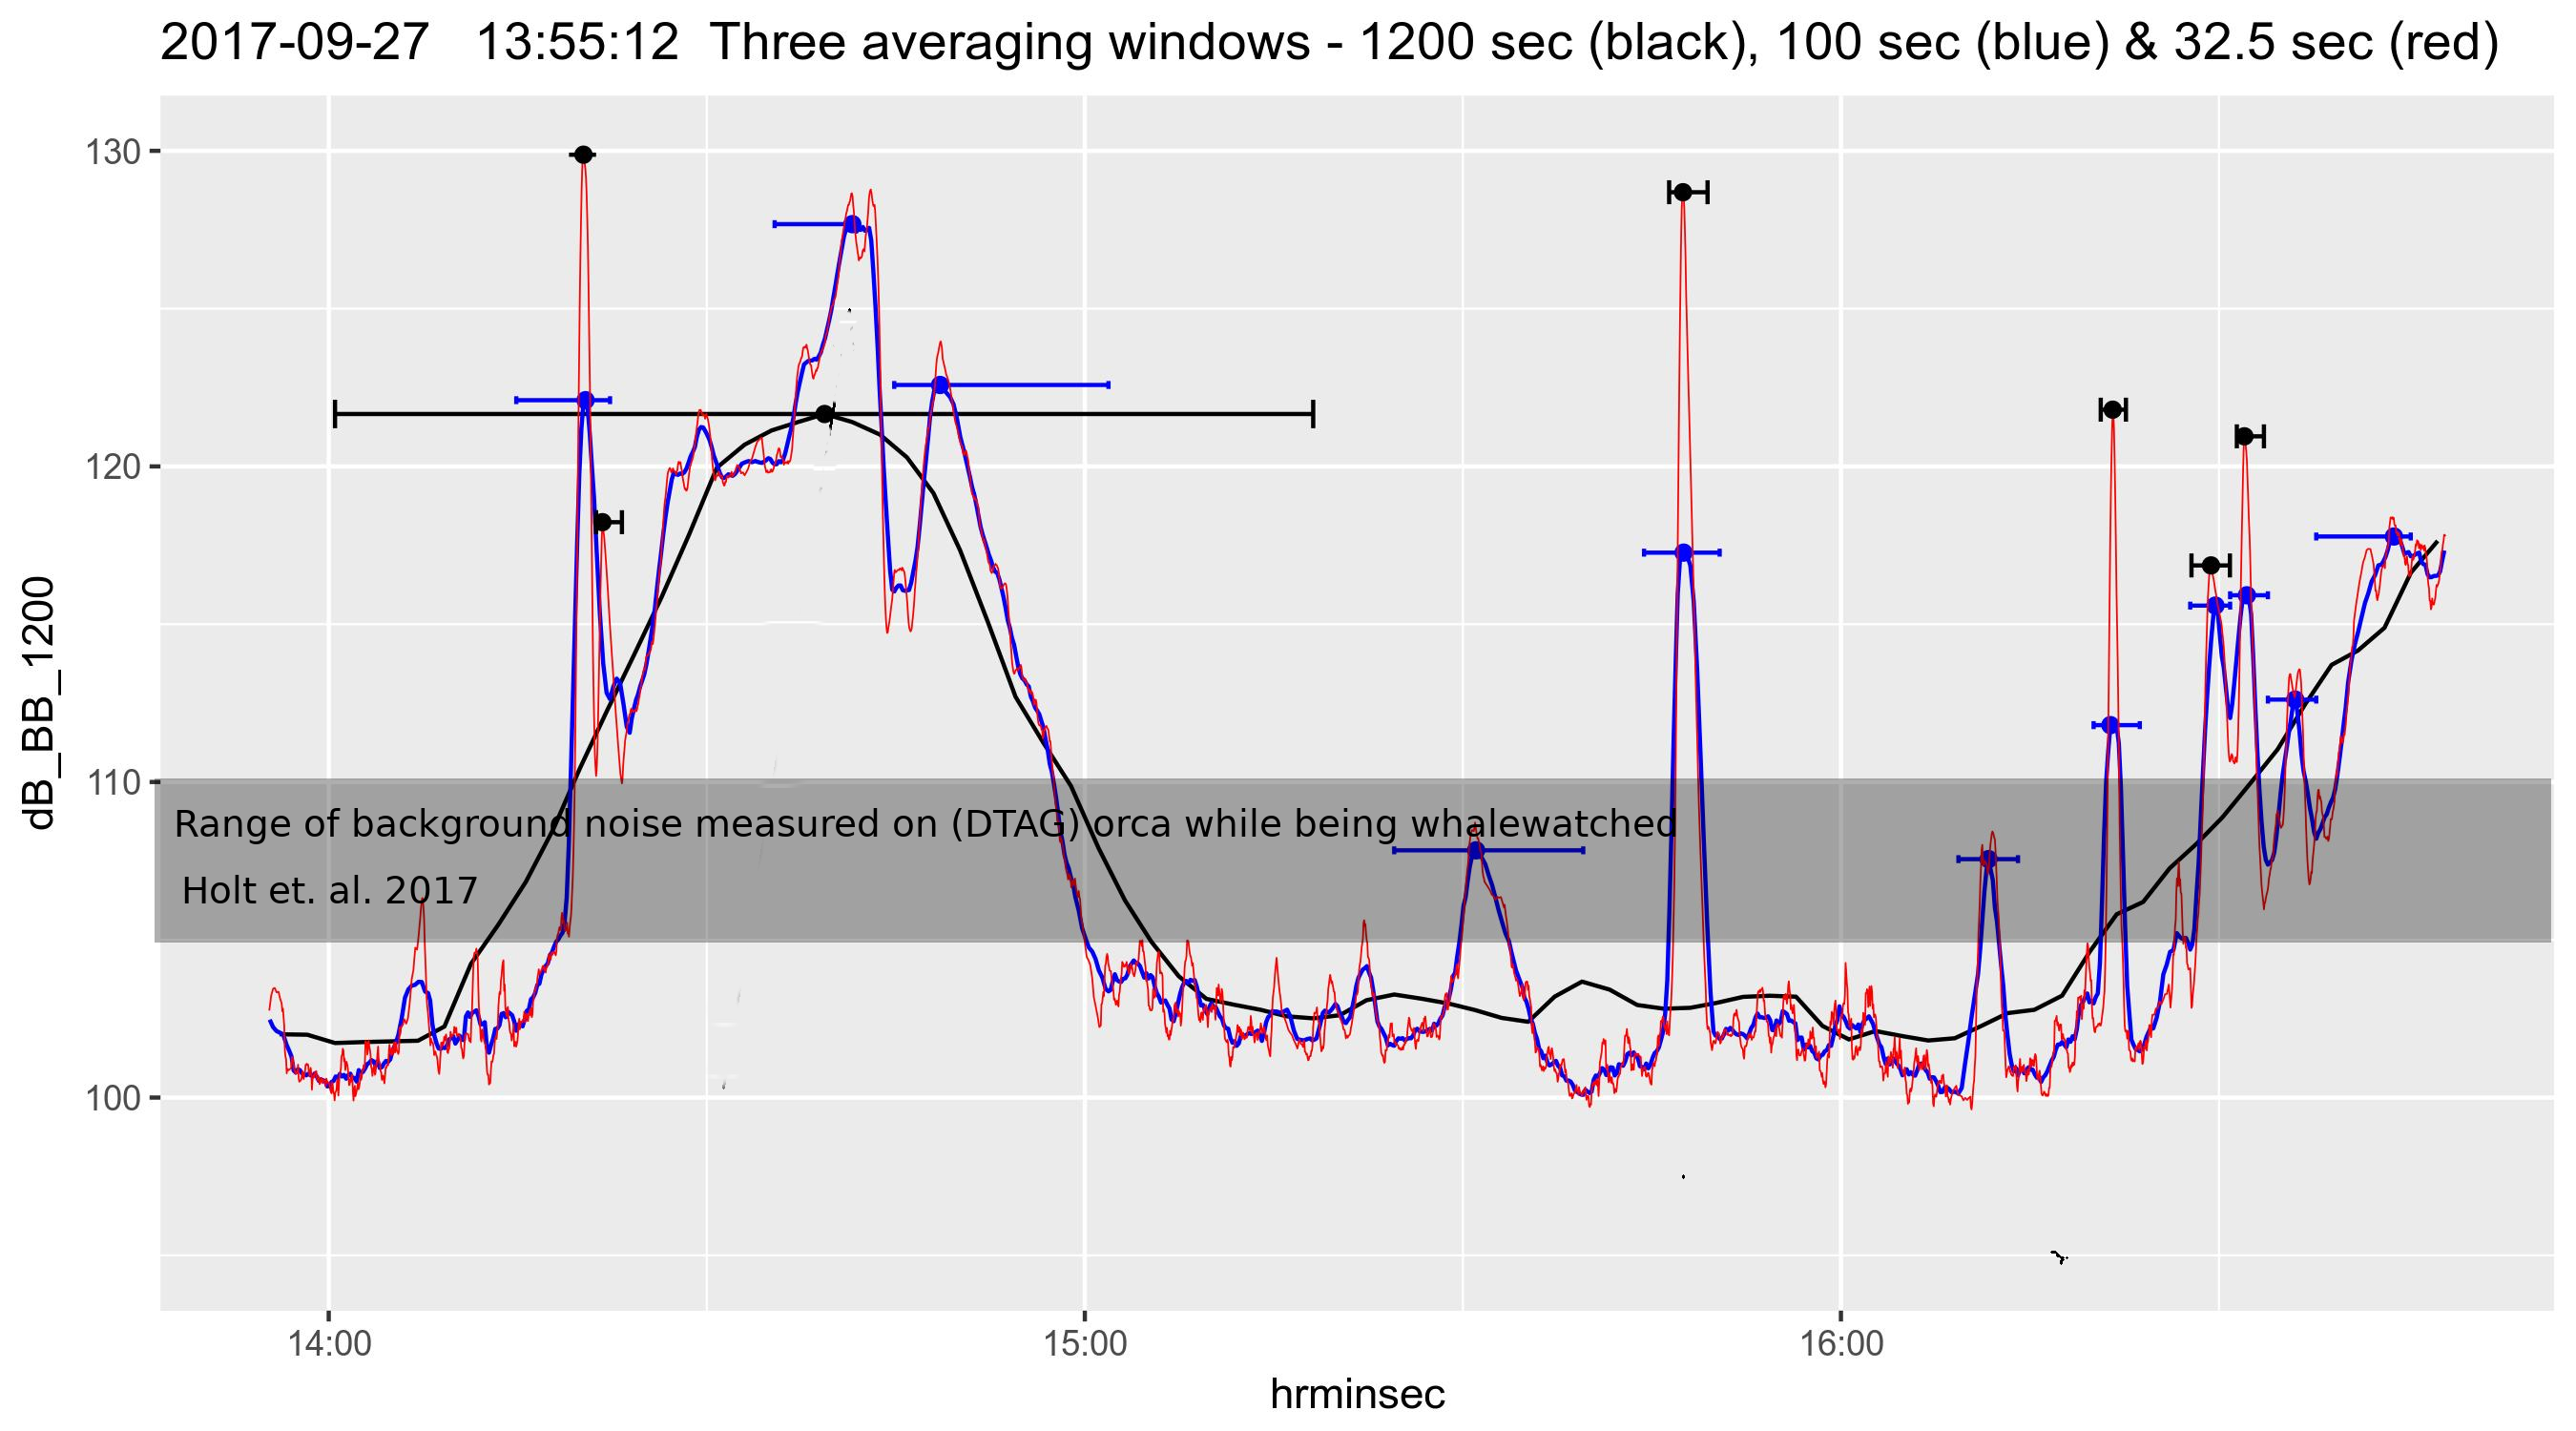
Peak validation example: 2 ships, boats, & SRKWs
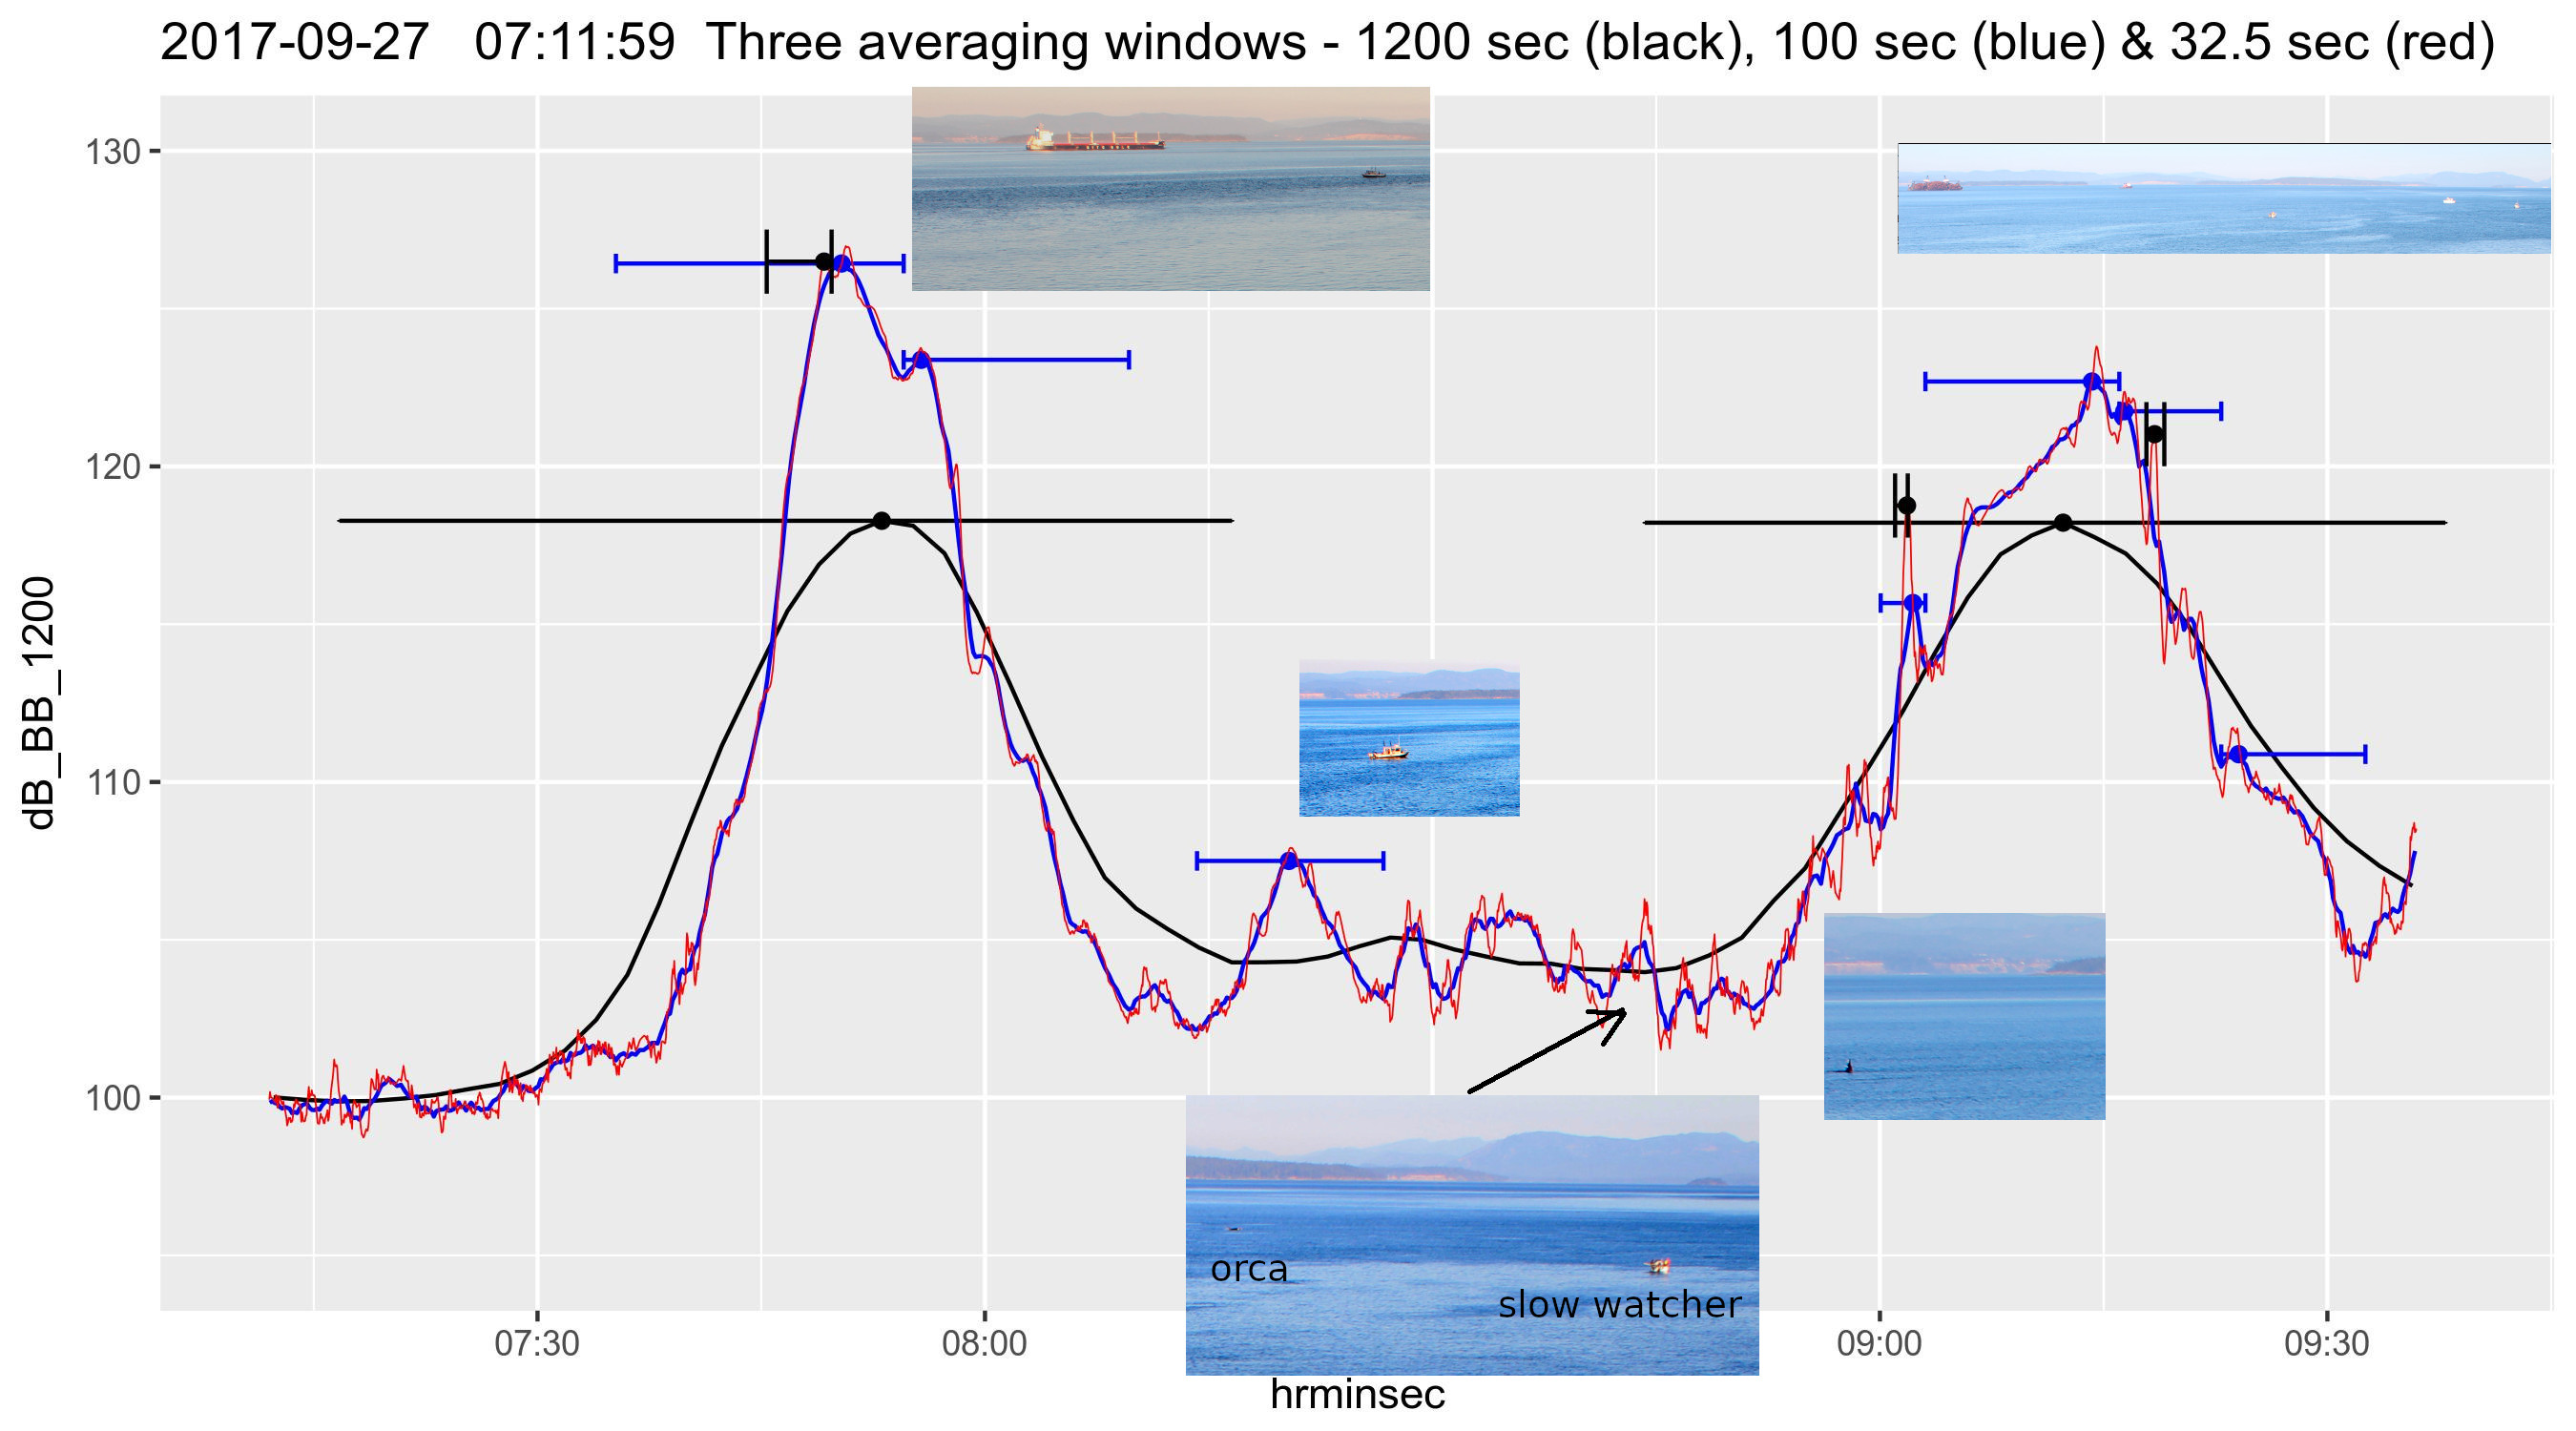 Smooth curve (black) is 1200 sec running average broadband dB levels
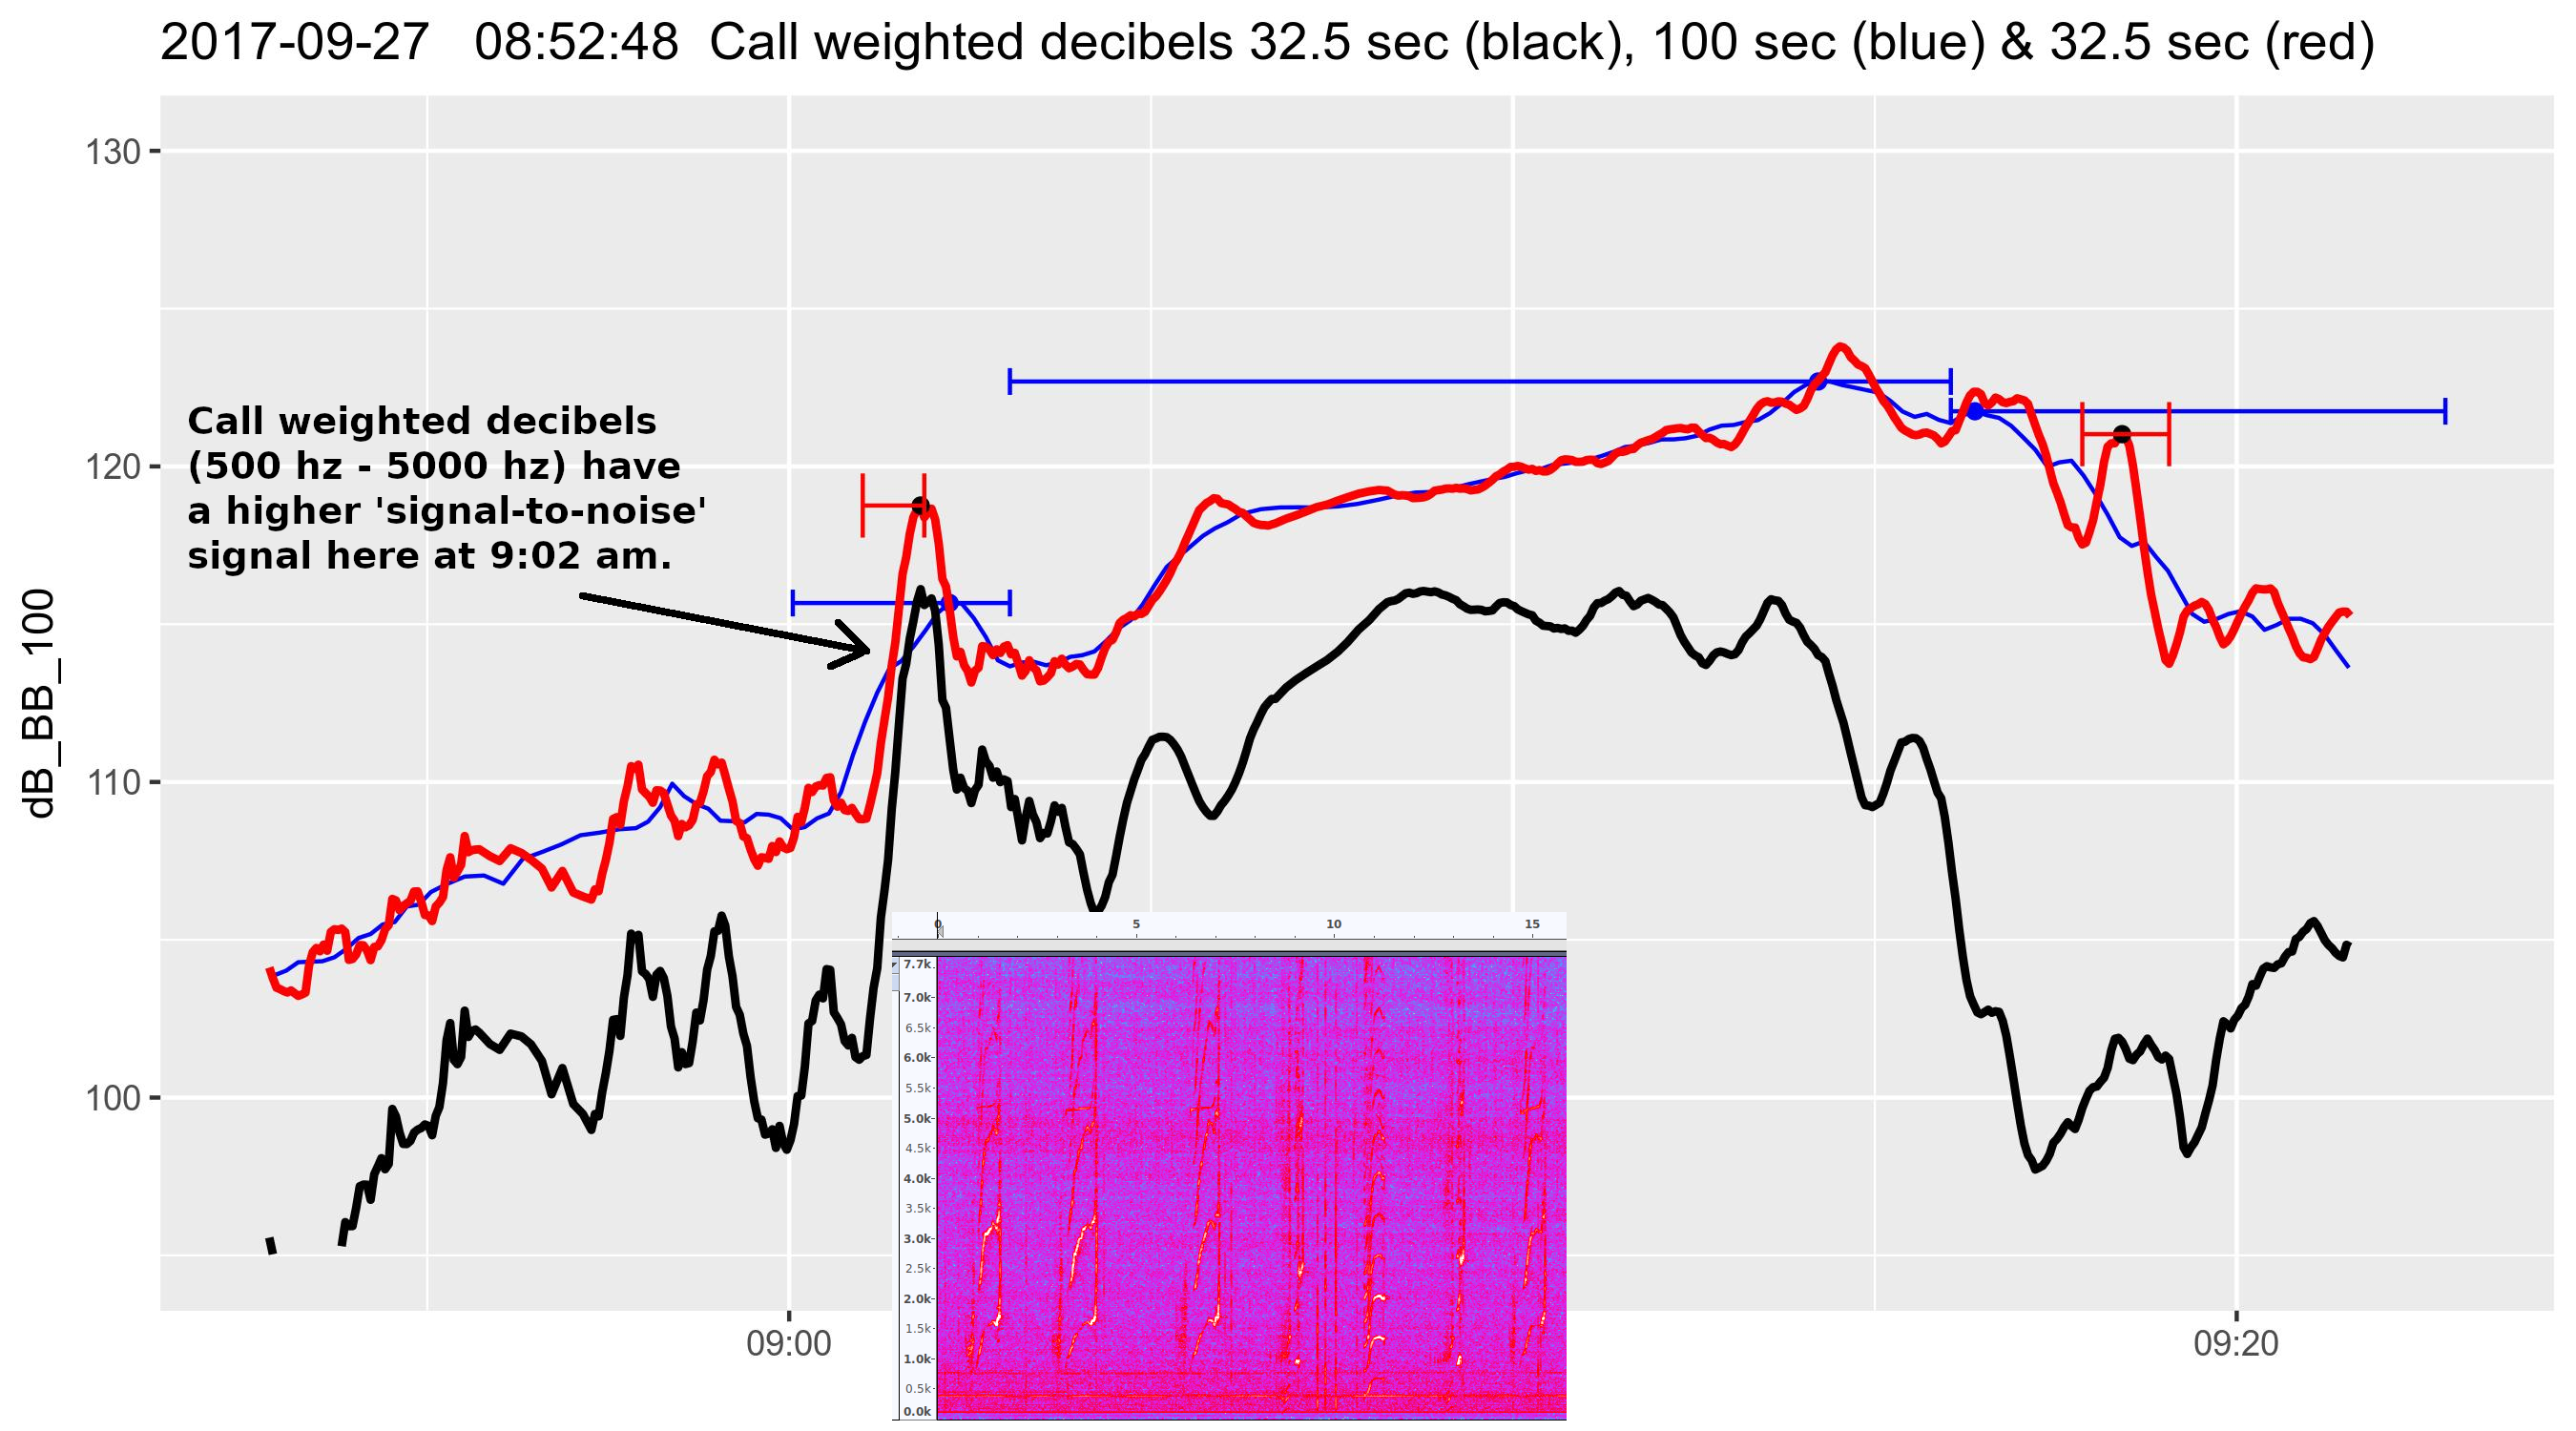
Peak validation example: killer whale calls
Peak validation example: overlapping vessels

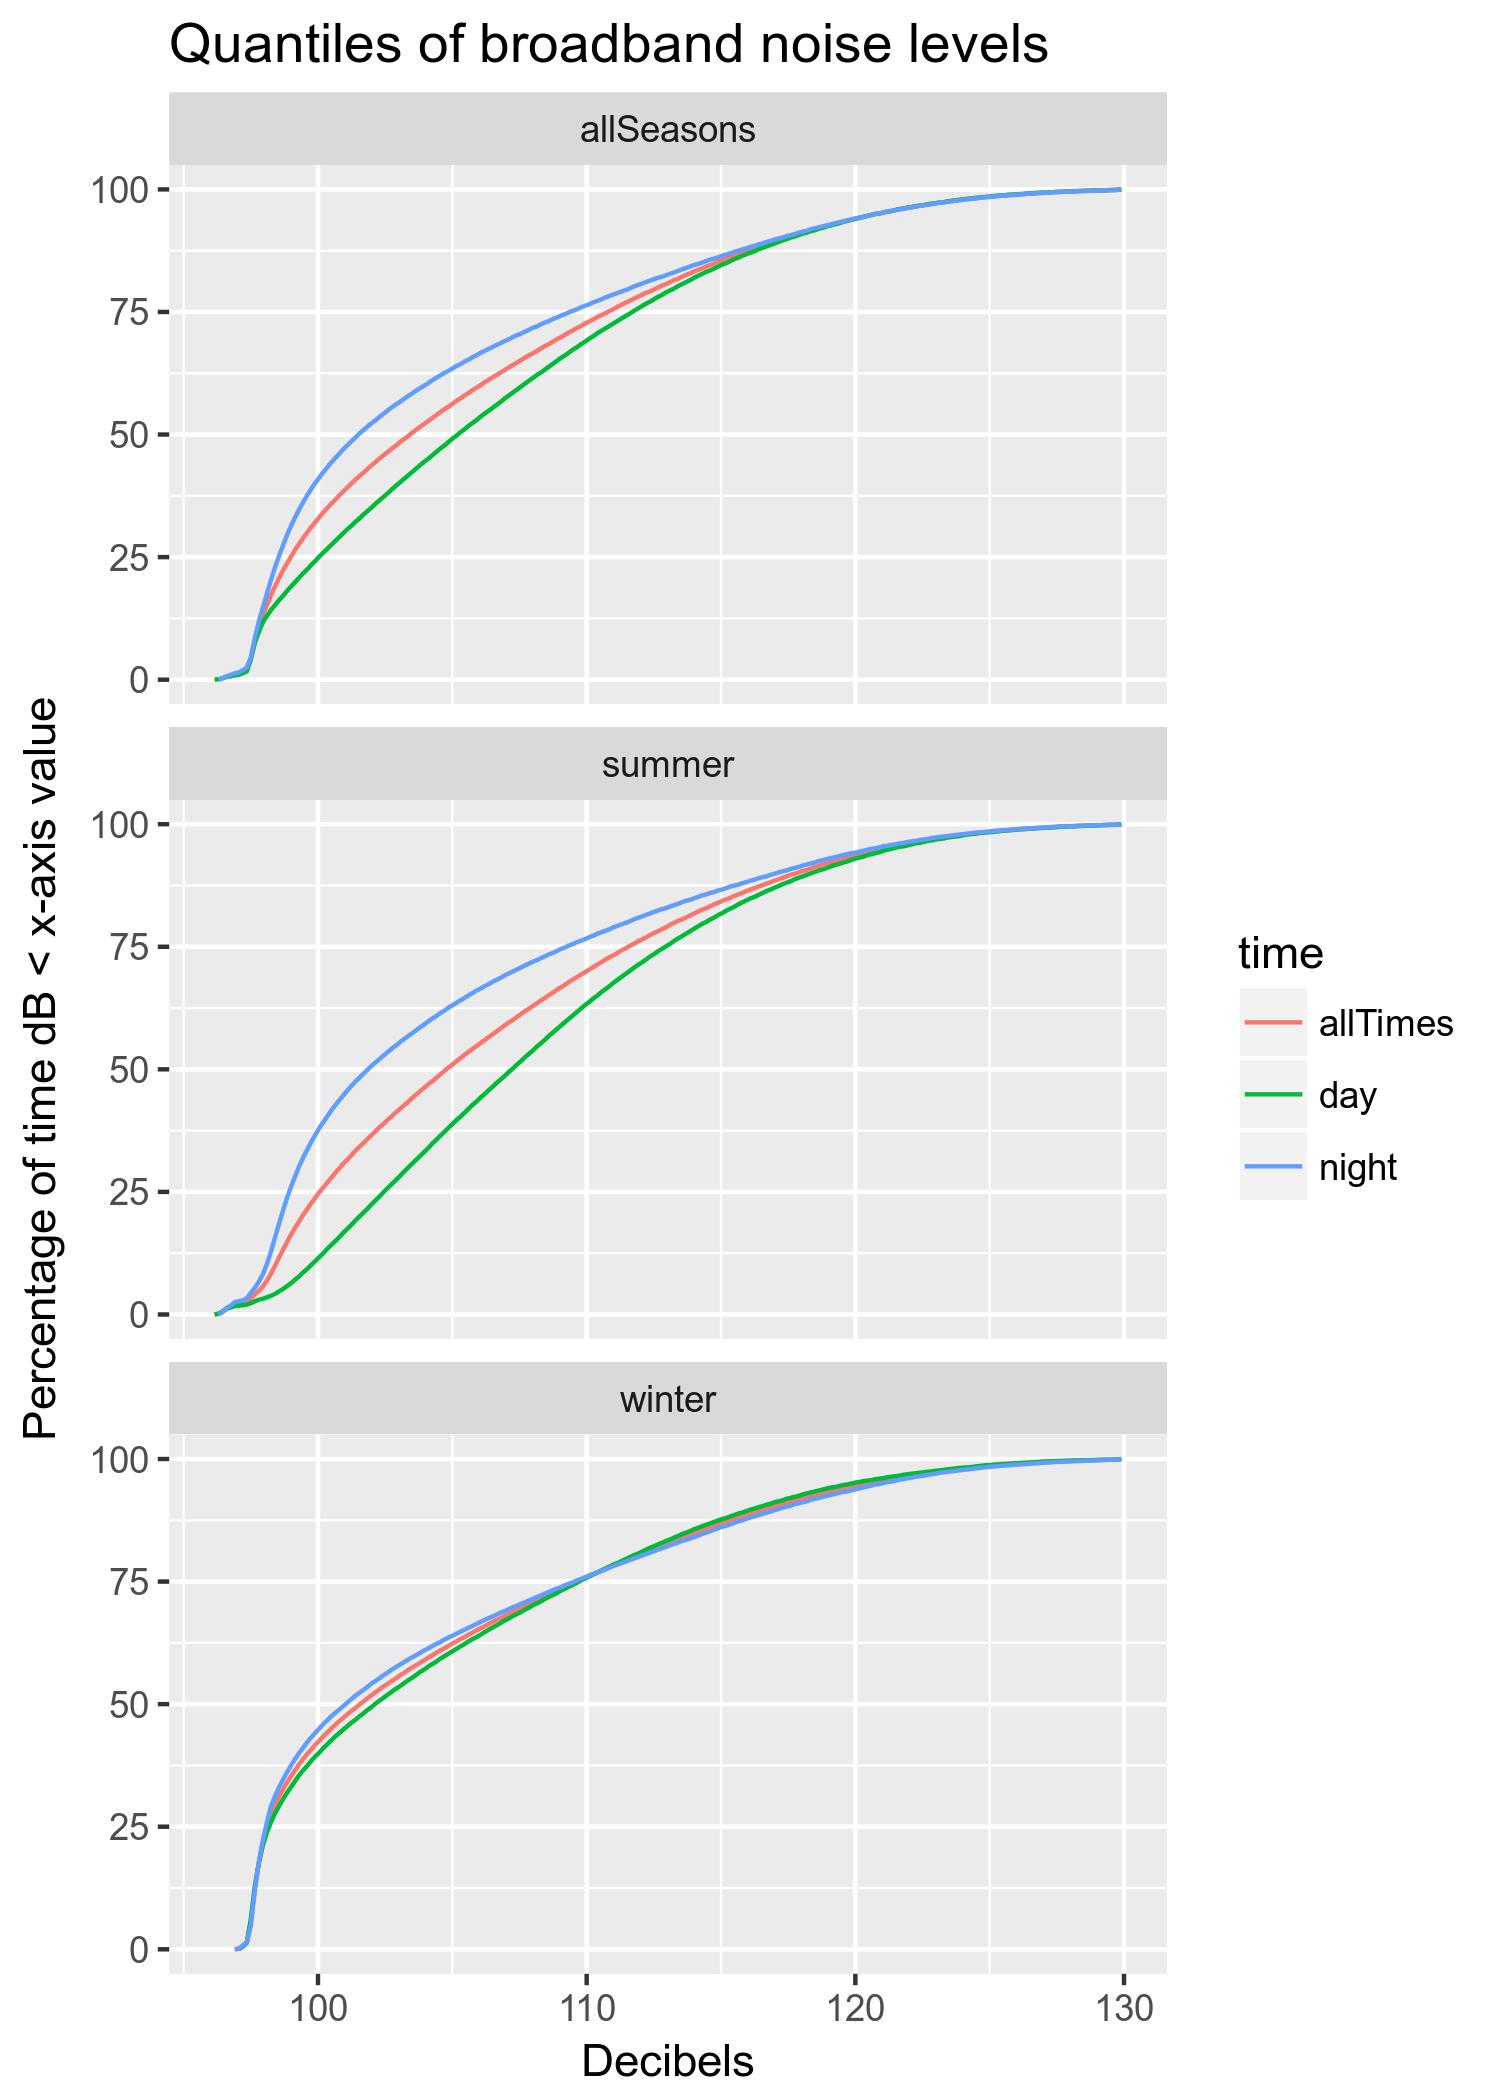
Broadband received level quantiles: seasonal and diurnal differences
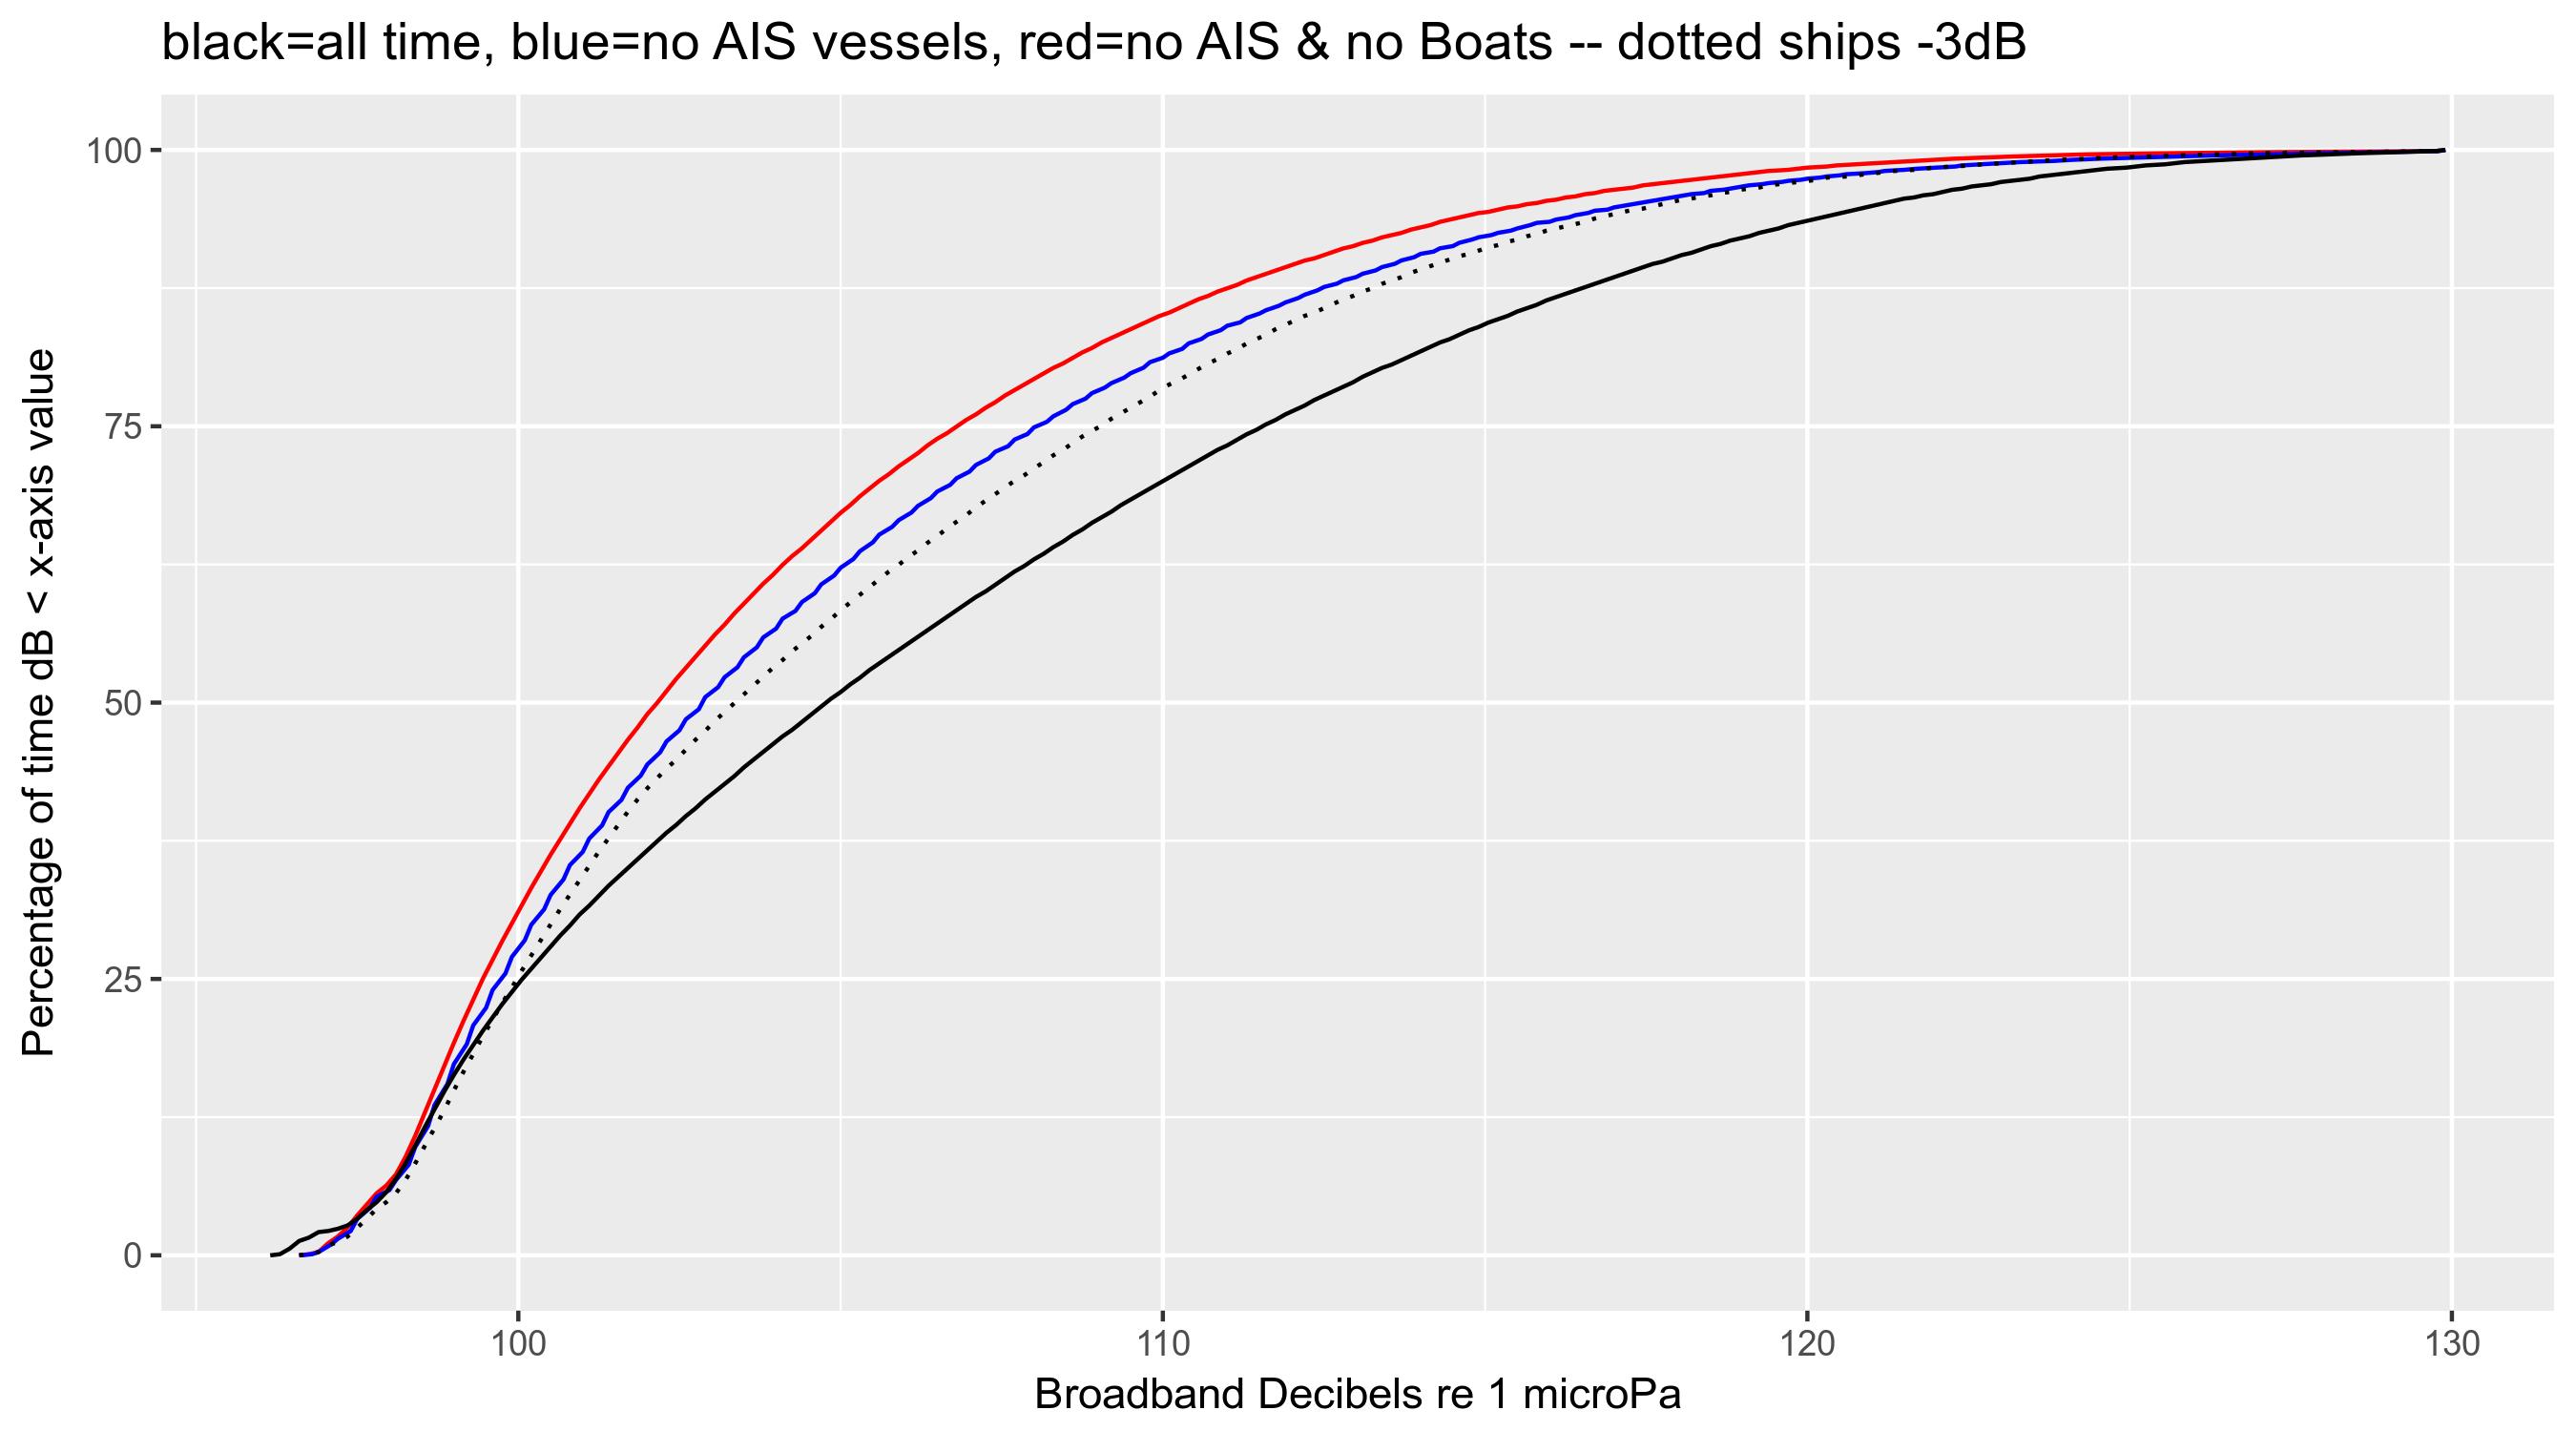
Quantiles of the broadband noise over a one year period (2017)The y-axis is the percentage of the time that the dB level is less than the corresponding x-value.
|
 |
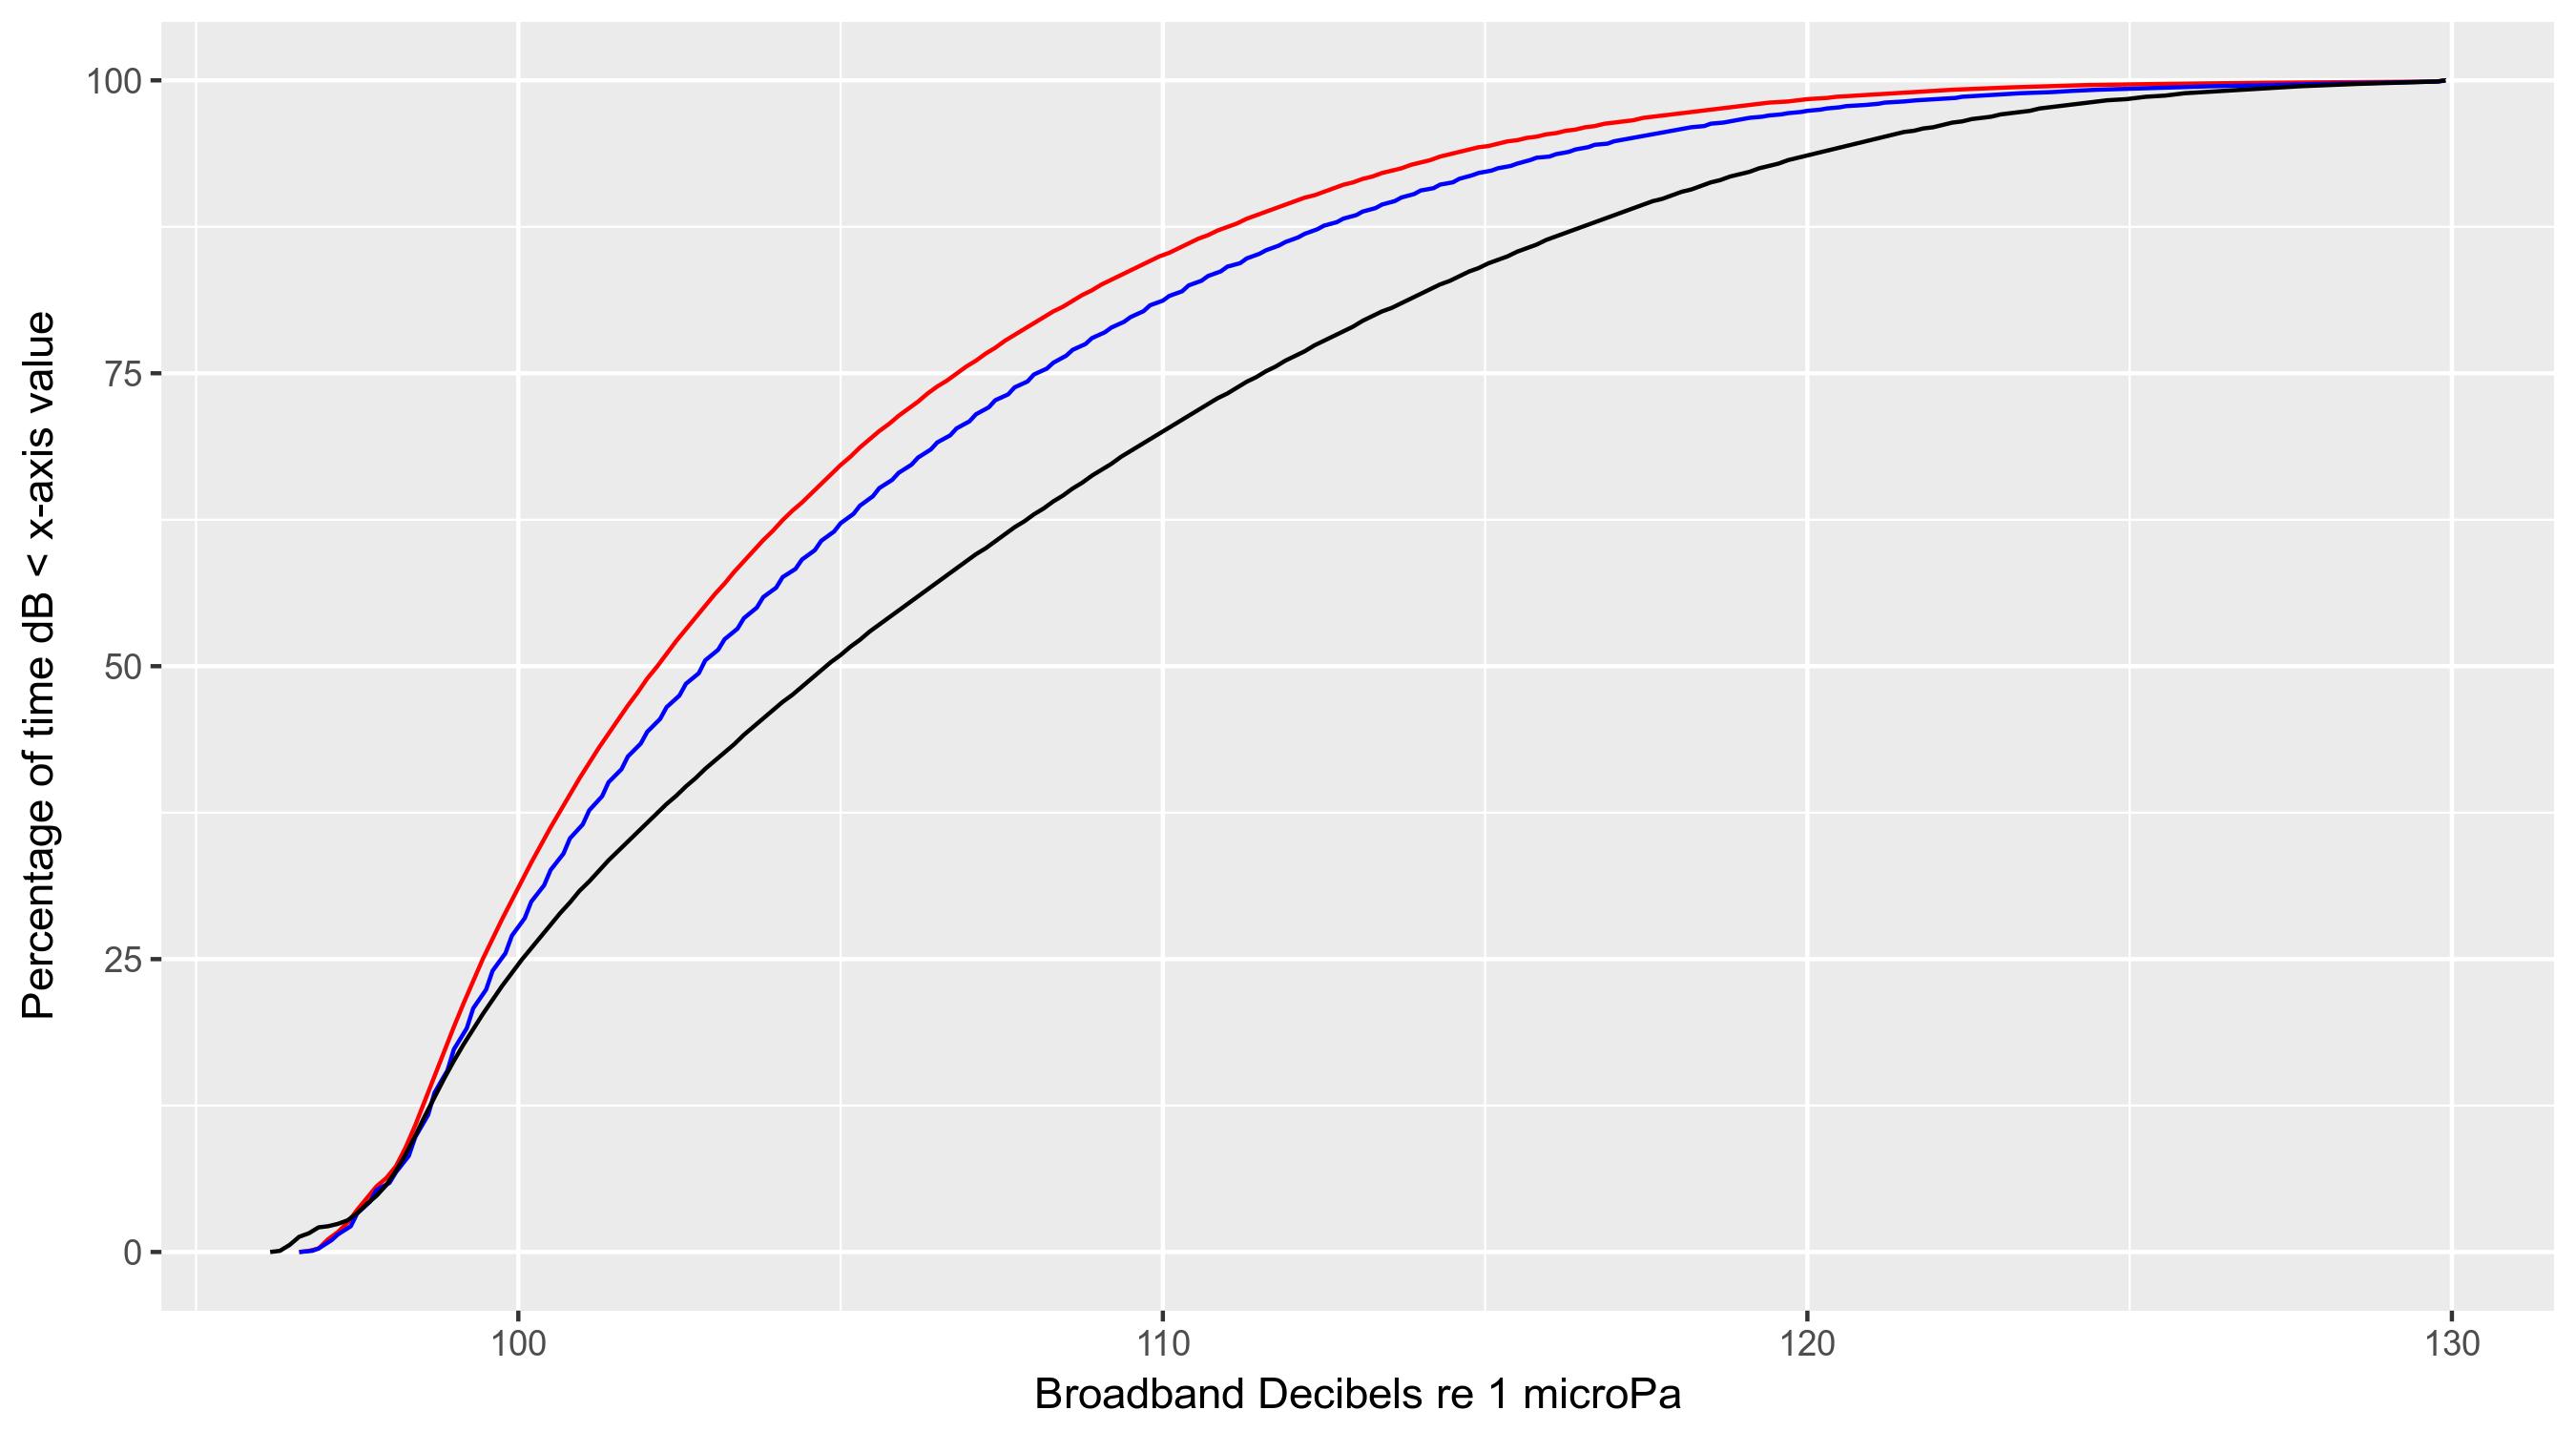
Broadband summer received level quantiles
How does the cumulative distribution change upon removal of local anthropogenic sources?
Legend:Received levels from all sourcesRL without ships RL without ships or boats
|
 |
New noise metrics from local quantiles?
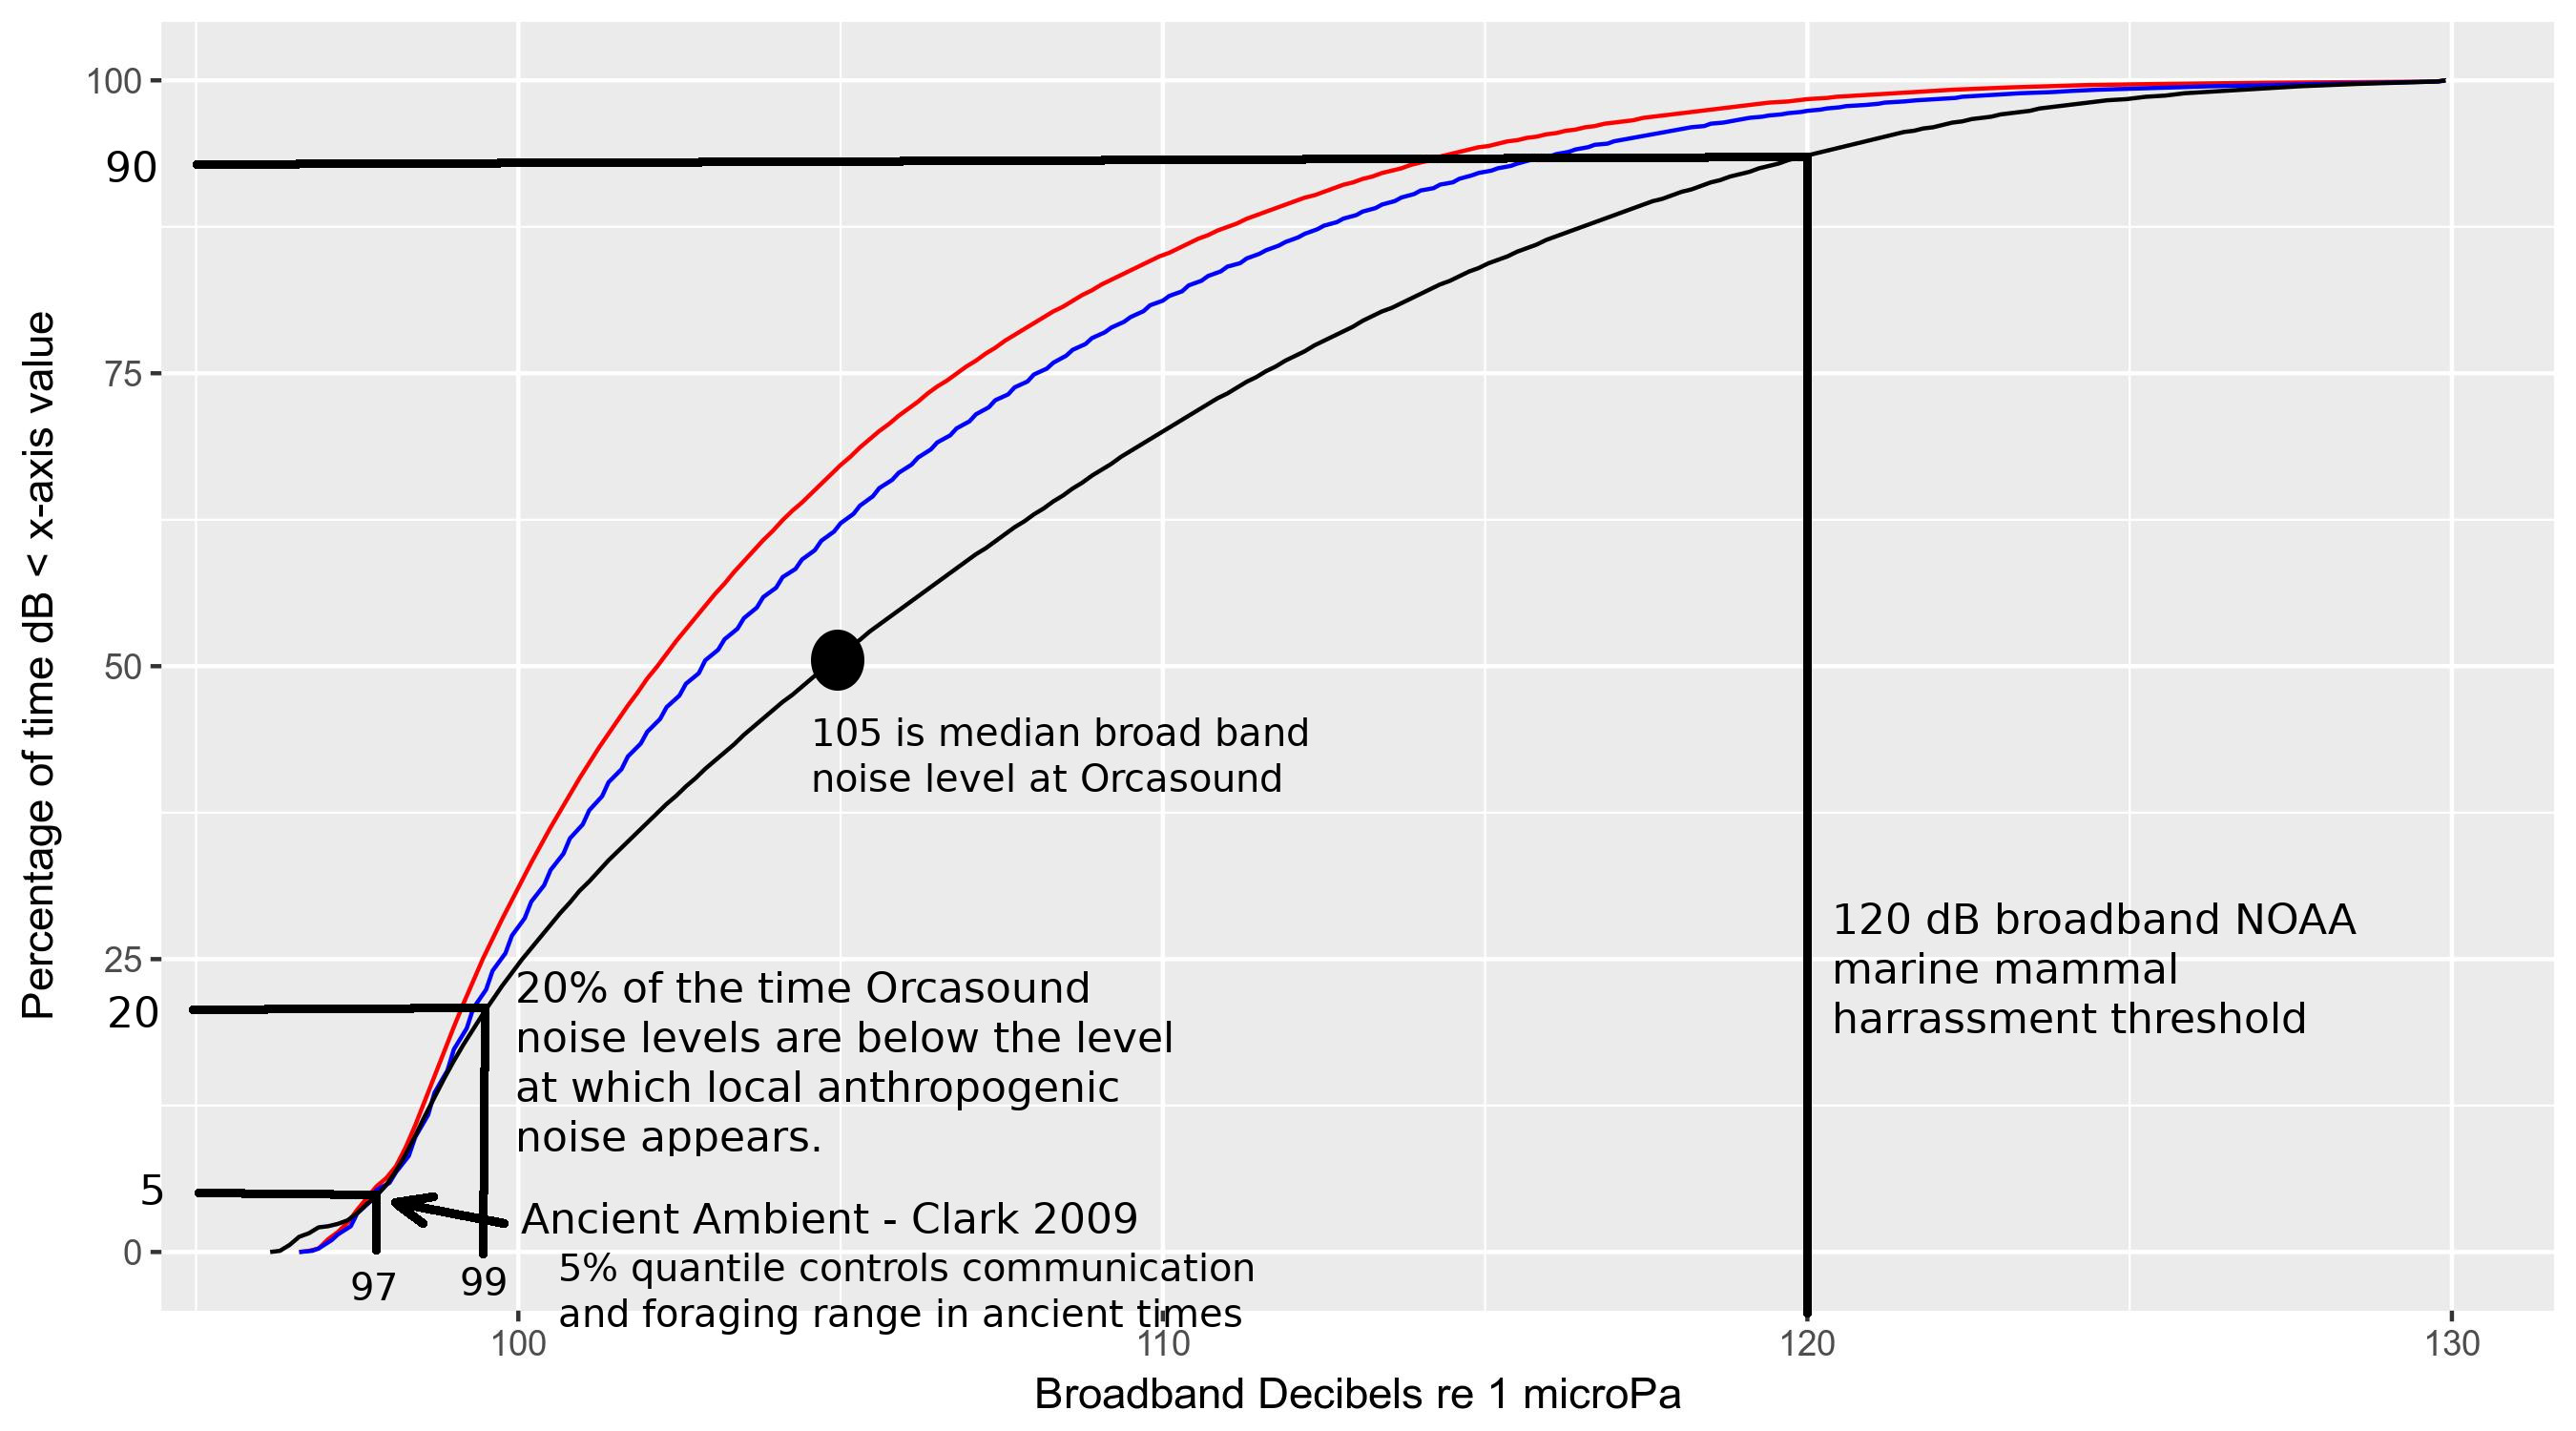
"Urban ambient" noise levels?
Background levels based from time series of receive level with local anthropogenic sources removed.
Proposal for new acoustic metrics
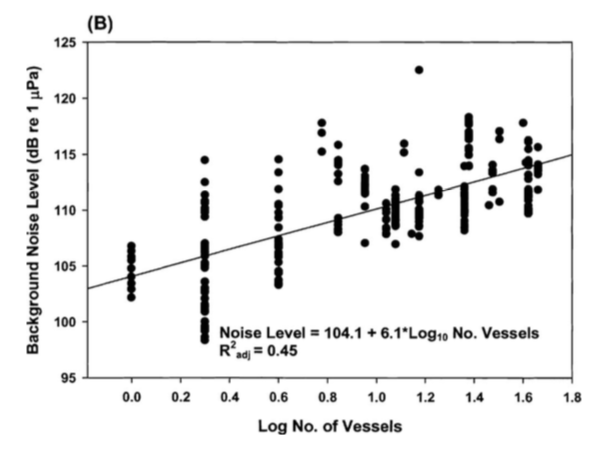
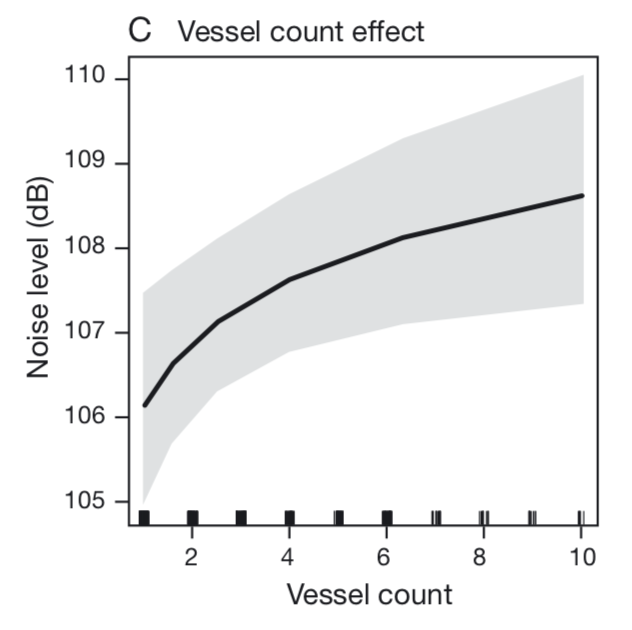
Urban ambient noise level: a baseline for "delta" noise metrics for SRKWs
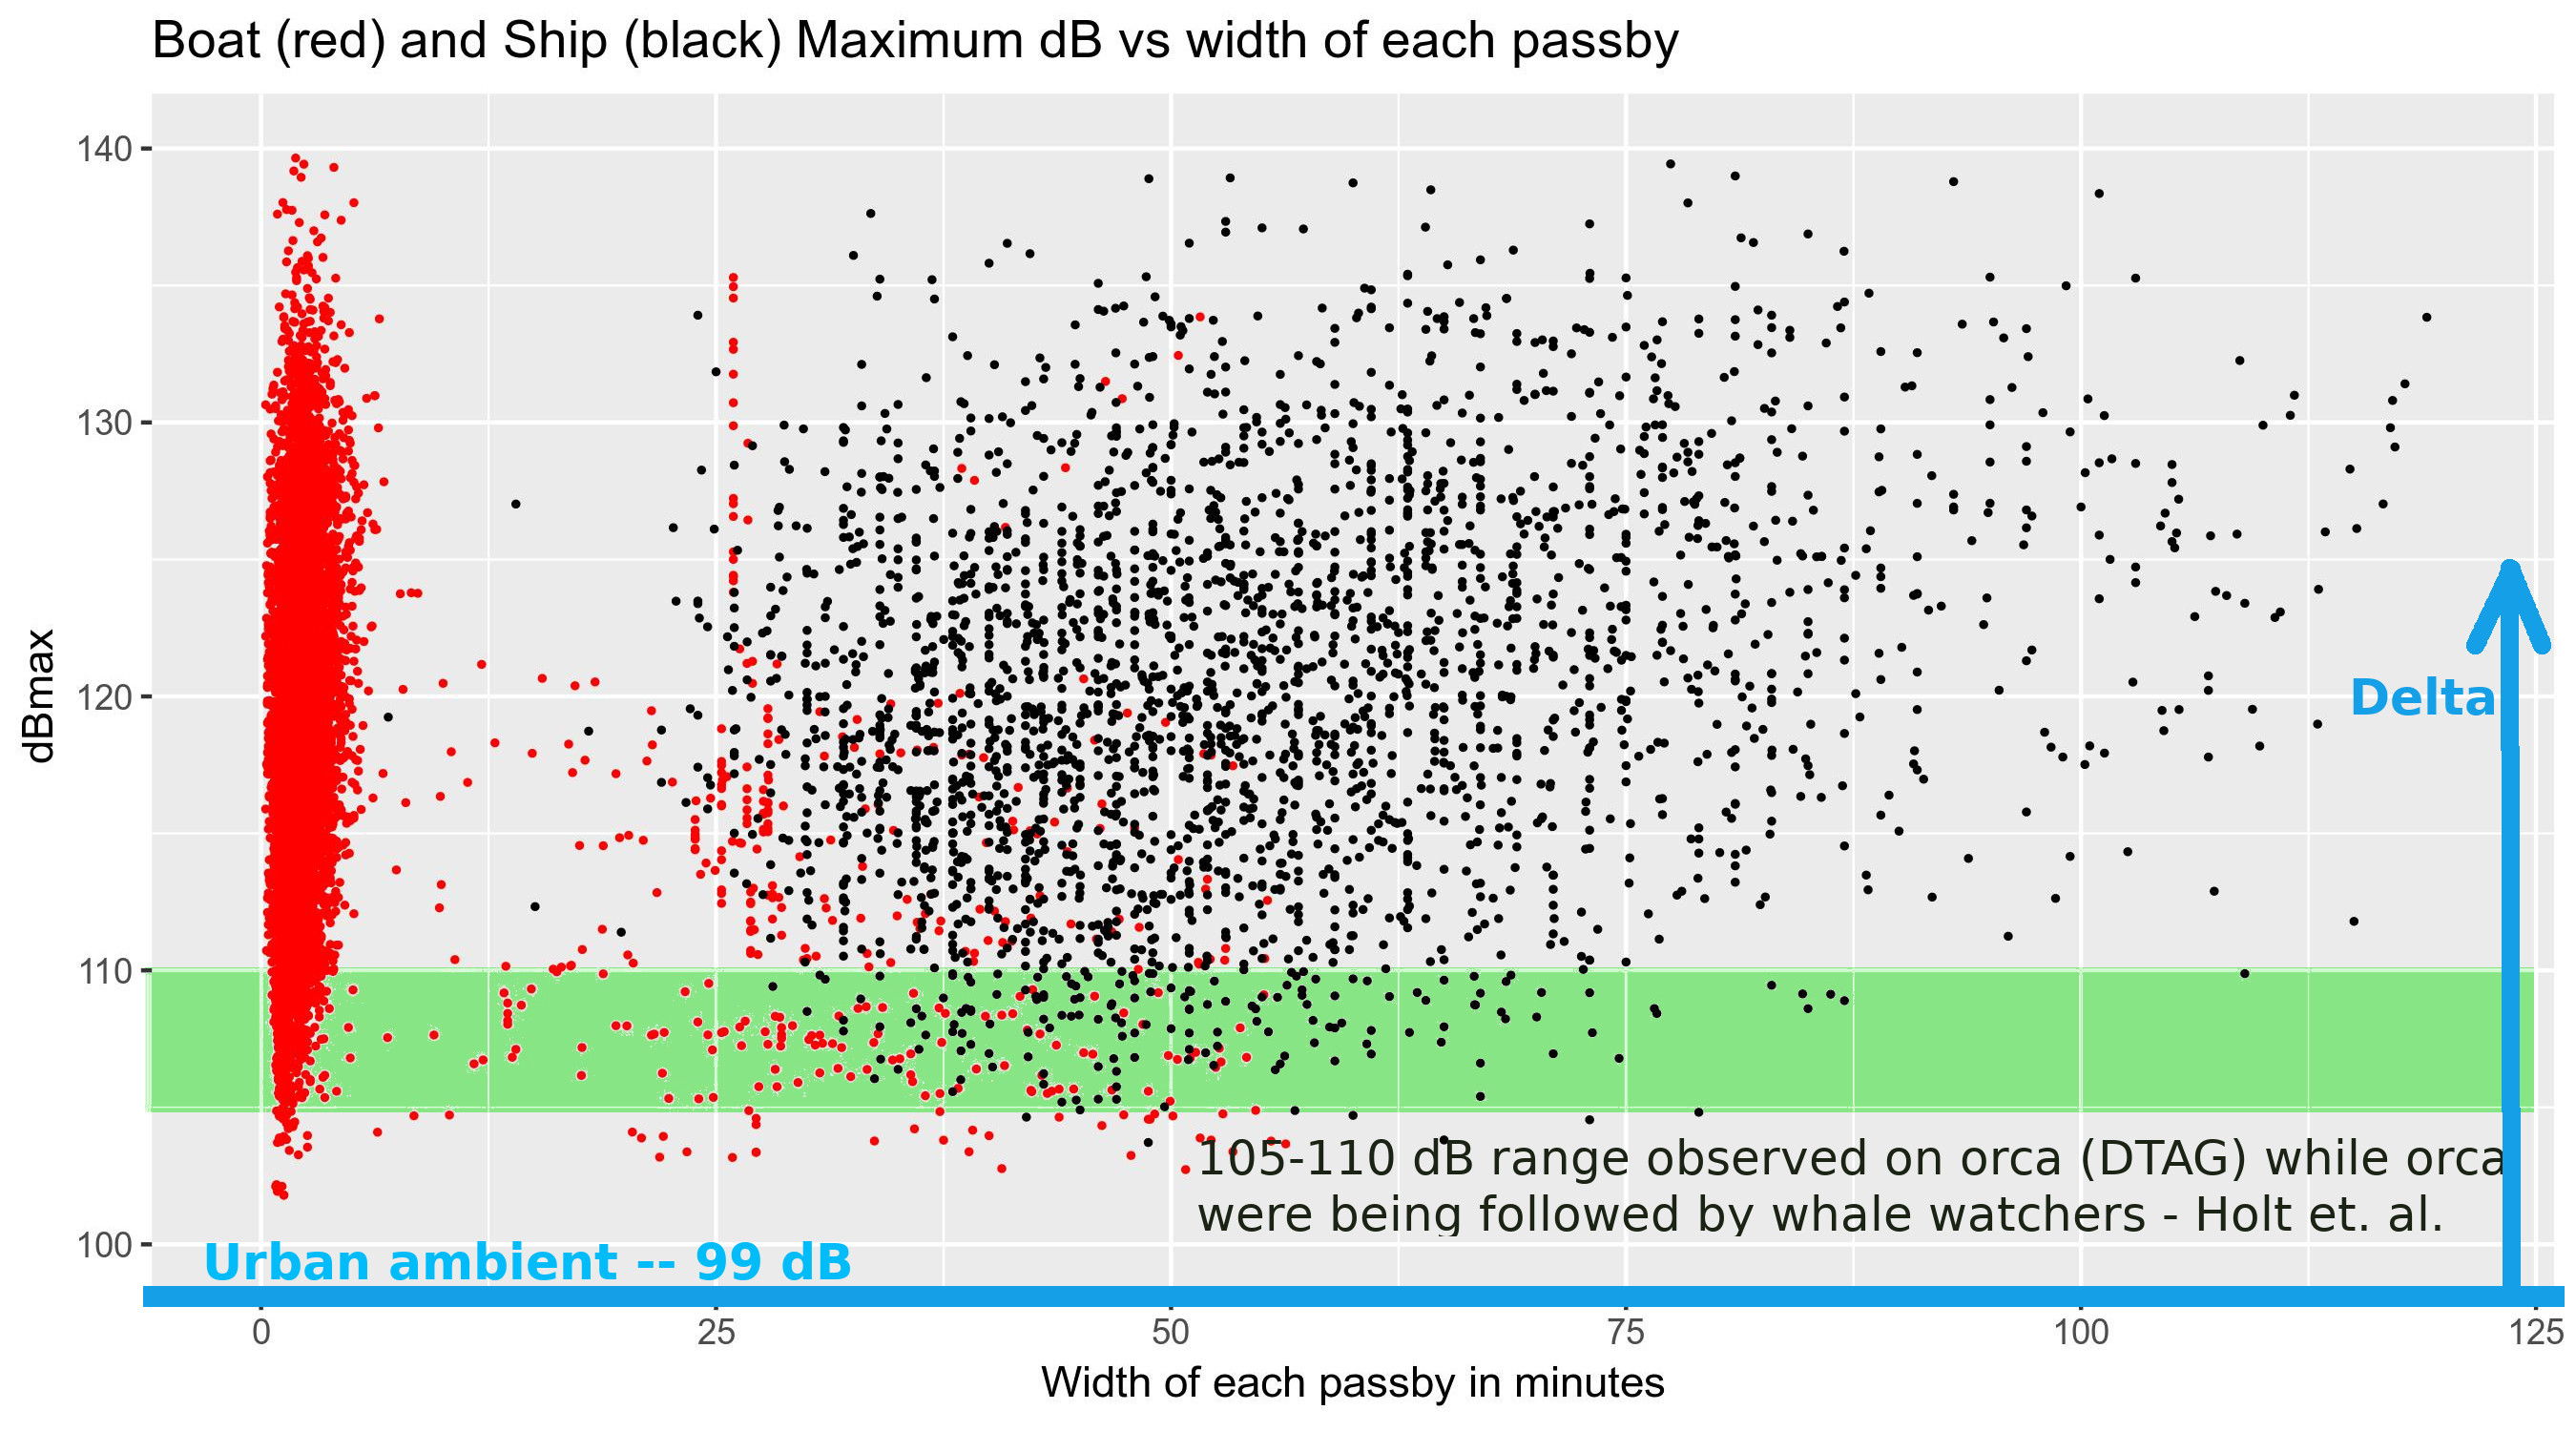
Holt et al., 2017, Endangered Species Research
Measurements of RL within the whale watching fleet
 |
 |
 |
(0.1-100 kHz, 60s) |
(1-40 kHz, 0.25s) |
(1-40 kHz, 1s) |
Proposal for new acoustic metrics (for orcas in an urban estuary? eleswhere?)
What baseline for computation of "delta" noise metrics?
Broadband summer received level quantiles
What if we achieved the Okeanos Pledge in the Salish Sea?
-3 dB every 10 years...
Legend:Received levels from all sourcesRL without ships RL without ships or boats
|
 |
/