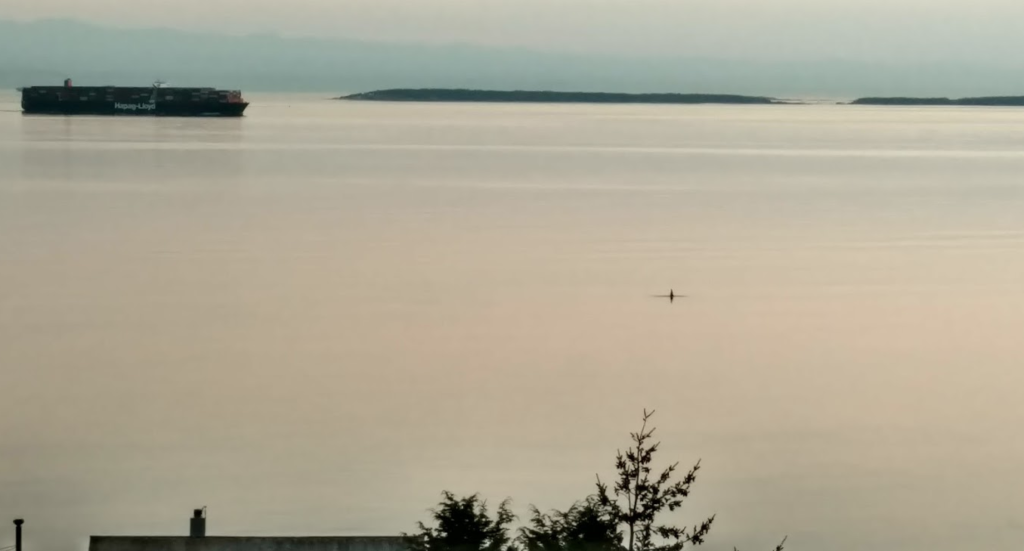
We have now backed up all of the visual, acoustic, and AIS data that we collected during the 2017 vessel slow-down trial (Aug 7 – Oct 6). This post presents a synopsis of these raw data and processed data, including initial quantification of the data coverage and sample sizes. Importantly, we cannot provide preliminary results here as we are still seeking funding for analysis, nor can we yet project when preliminary or peer-reviewed results will be available for comparison with the preliminary data report published in November 2017 by the ECHO program (archived PDF). We are also providing the media and public with open access to photos taken during the 2017 field season.
Overview
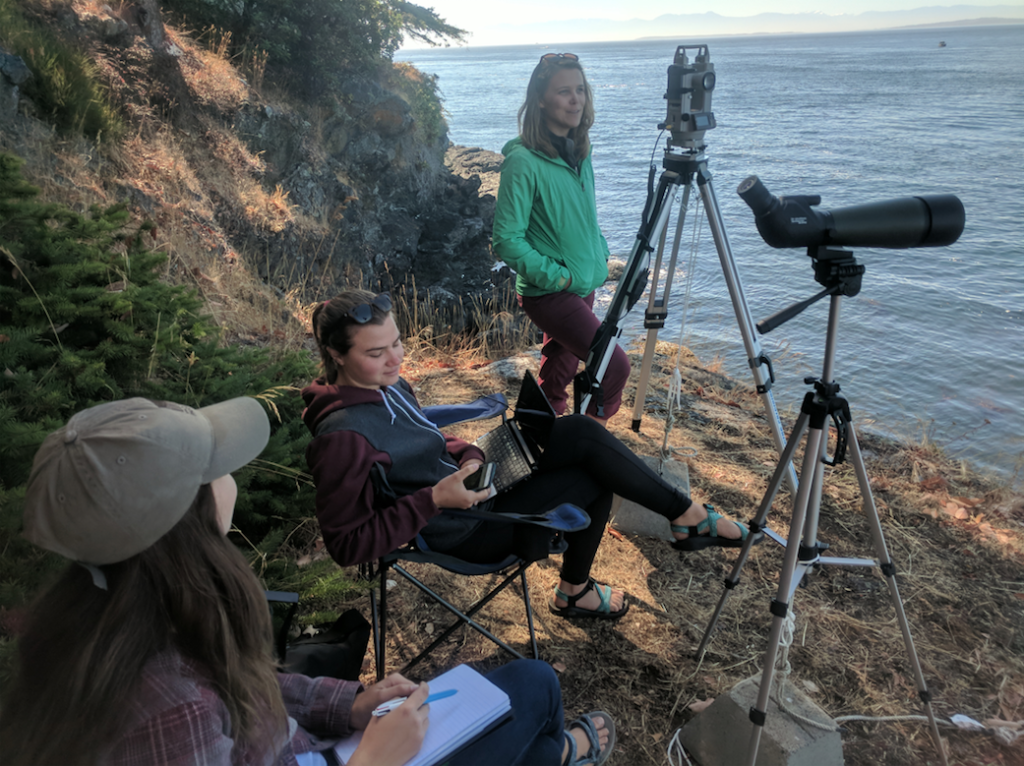
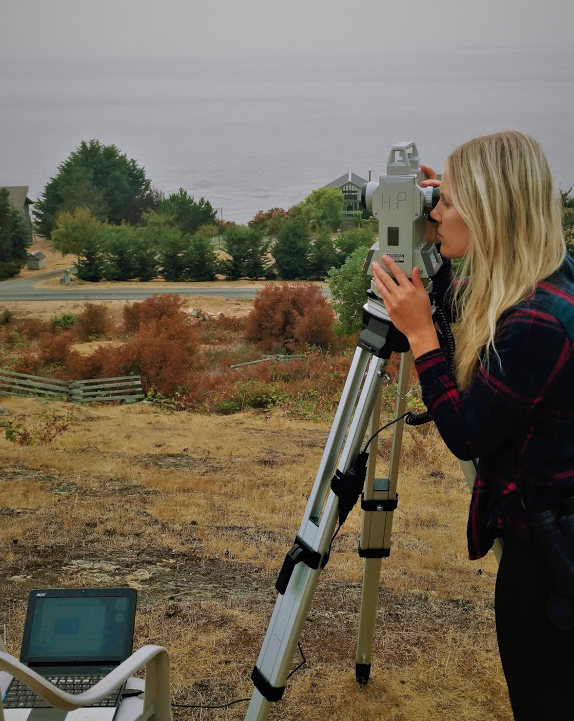
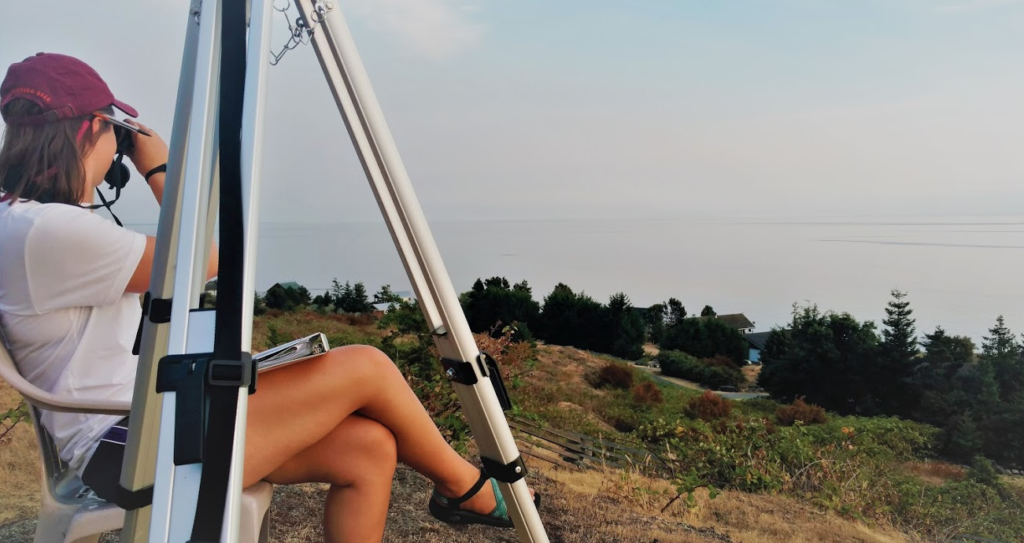
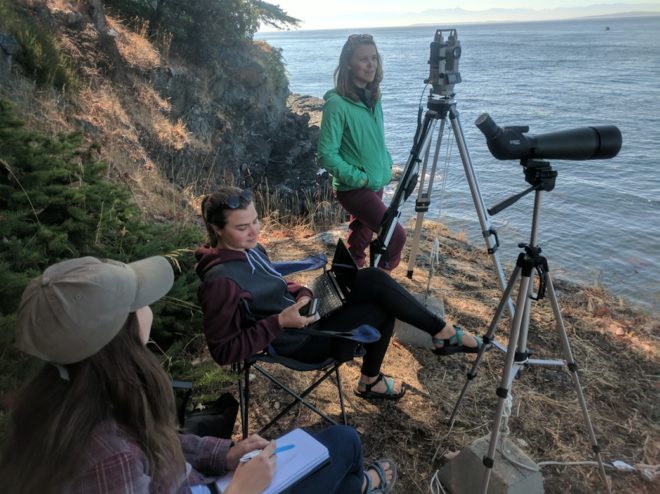
In much of August, September, and October of 2017 a research team led by Oceans Initiative made land-based observations of marine mammal behavior from the west side of San Juan Island (WA, USA) with the primary goal of measuring the potential behavioral responses of endangered southern resident killer whales (SRKWs) to the voluntary slow-down of vessel traffic in Haro Strait (organized by the Port of Vancouver’s ECHO program). The behavioral observations consisted of continuous focal follows (tracking an individual whale with a theodolite) and scan samples every 5 minutes (assessing group behavioral state and proximity of vessels).
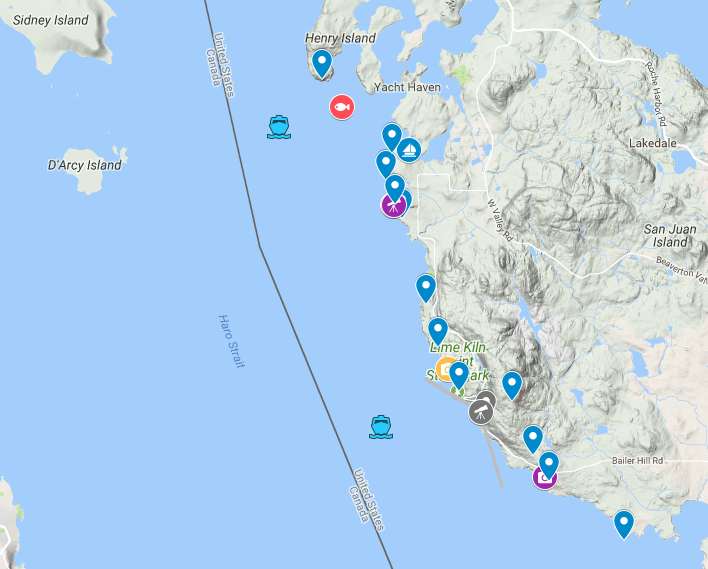
The land-based team operated from two sites (see static map above, or Google map version). The northern site, known as Orcasound Lab and hosted by Val and Leslie Veirs (SPC), is located ~5 km north of Lime Kiln State Park. The northern site was co-located with calibrated hydrophones maintained by Beam Reach as part of the Orcasound hydrophone network and provided the team with a vantage point on a bluff about 10m above sea level and 10 meters inland from the shoreline. Beam Reach made continuous recordings of the nearshore hydrophones (located within 50m of the shoreline at depths of ~10m) and logged Automatic Information System (AIS) transmissions from passing ships.
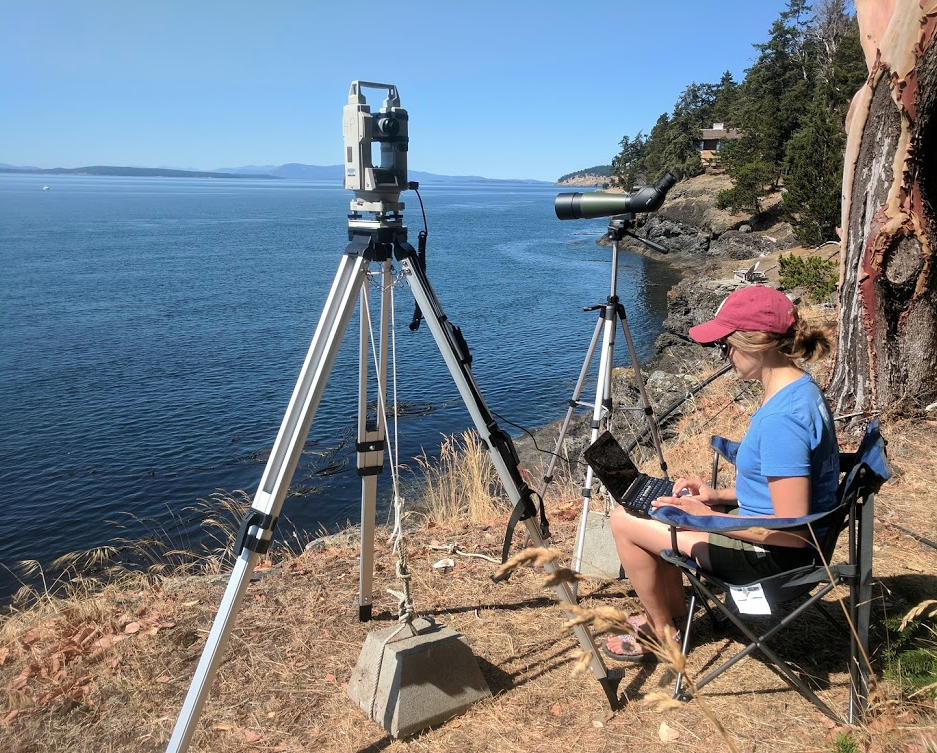
The southern site was located in the Hannah Heights area, 3.5 km south of Lime Kiln. Hosted by Sharon Grace, the vantage point had an elevation of ~50m above sea level and was ~200m inland from the shoreline. Continuous calibrated hydrophone recordings for assessing noise exposure were not made at this at site, but recordings from the nearby Lime Kiln hydrophones (~50m offshore at a depth of ~20m) are being provided by Dom Tollit and Jason Wood of SMRU Consulting.
Behavioral data
Thanks to financial support from private donors and the Canadian Department of Fish and Oceans, the teams from Oceans Initiative and Ocean Research Conservation Association were in the field for ~41 days between 08/19-10/03/17. While SRKWs were not sited in inland waters prior to Sep 4, Bigg’s (aka transient) killer whales were common. After Sep 4 the SRKWs occupied Haro Strait more frequently, though still well below their historic prevalence. This unusual temporal distribution of killer whale ecotypes resulted in nearly equal data coverage: about 5 days for each.
| Ecotype | Data days | Data hours |
| SRKW | 5 | 7.98 |
| Biggs | 5 | 5.07 |
| Totals: | 10 | 13.05 |
In the following tables we break down these ~10 days of observations in two ways — by type of data acquired (focal follow vs scan sample) and by ecotype (SRKW vs Bigg’s). Pending further analysis of the number of tracks per session, the theodolite data coverage is quantified as uninterrupted sessions. The number of days with theodolite data is less than the total scan sample days because on some days there was only one observer available (2-3 are needed to acquire theodolite data).
Theodolite data table
The total number of minutes in which theodolite data were collected is 468 minutes (SRKWs and Biggs). About 2/3 of the data were observations of SRKWs. We’re proud that the team was trained and ready on the day (9/4) the SRKWs surprised everyone by returning after a month-long hiatus!
| Ecotype | Date | Sessions | Time (min) |
| SRKW | 09/04/2017 | 1 | 33 |
| 09/06/2017 | 1 | 95 | |
| 09/27/2017 | 2 | 170 | |
| Totals: | 4 | 298 | |
| Biggs | 09/02/2017 | 2 | 75 |
| 10/03/2017 | 2 | 95 | |
| Totals: | 4 | 170 |
An additional session was spent tracking a control (the Oceans Initiative research vessel “Wishart”). During each SRKW session, the focal animal typically surfaces on average every minute or two, so the number of minutes is approximately equal to the number of times a focal animal was located, or “fixed.” Each pair of fixes will generate a wealth of information about the focal animal: swim speed, respiration rate, direction (and changes in direction). Additional fixes (between respirations) can provide additional information about the distribution of whales in a group and the location of nearby vessels.
Scan sample table
Scan samples were taken every 5 minutes using a combination of the spotting scope and the naked eyes of the observers. In all cases there were boats present. In about half of the SRKW scan samples (233 total) ships were not present; the other half will present opportunities to compare behavior when slow vs fast ships were present. For Biggs scan samples, 98% were made with ships present, giving us an unexpected way to increase our sample size (if we expand our question to include the responses of both SRKWs and Biggs killer whales to slowed ships).
| Ecotype | Date | Scan Samples | Ships Present? | Boats Present? | Time (min) |
| SRKW | 09/04/2017 | 17 | Y | Y | 80 |
| 09/06/2017 | 19 | N | Y | 95 | |
| 09/13/2017 | 14 | N | Y | 65 | |
| 09/22/2017 | 23 | N | Y | 73 | |
| 09/27/2017 | 33 | Y | Y | 166 | |
| Totals: | 106 | 479 | |||
| Biggs | 08/19/2017 | 4 | Y | Y | 34 |
| 08/21/2017 | 14 | Y | Y | 95 | |
| 09/02/2017 | 13 | Y | Y | 75 | |
| 09/04/2017 | 2 | N | Y | 5 | |
| 10/03/2017 | 17 | Y | Y | 95 | |
| Totals | 50 | 304 |
With additional support we look forward to additional break-downs of these data. Most importantly, we can use simultaneous behavioral observations and ship tracking (AIS) data to determine when the whales were exposed to ship noise, or not, and whether any ships present were traveling at their normal speed, or complying with the voluntary slow-down speed limit of 11 knots through the water.
Acoustic data
Acoustic data during the 2017 SRKW behavioral study was acquired at our northern observation site by Beam Reach at the Orcasound Lab (elevation ~10m). The cabled, calibrated system monitored two ITC hydrophones located 20-40m offshore at depths of ~10m. Calibrations were made opportunistically before, during, and after the slow-down period with an Interocean Systems Model 902 during loud ship transits.
Northern site acoustic data synopsis
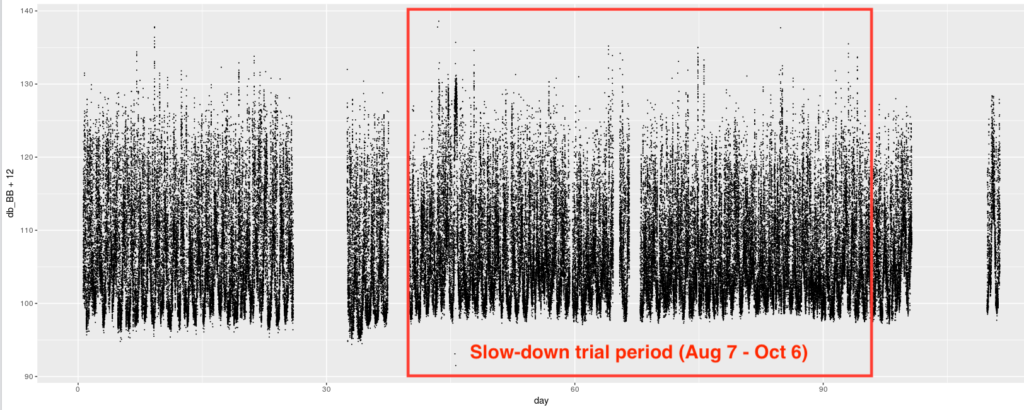
In late 2016, Beam Reach began recording continuously and logging 1-minute RMS underwater sound pressure levels at the northern study site (Orcasound Lab). Below is a time series of several million broadband received level measurements from June 29th to October 18 that shows we have near-continuous coverage during the slow-down trial (approximately days 39-96). Short gaps are due to the normal vagaries of data collection (e.g. San Juan Island power outages) and to a couple short periods that we excised because of unexplained minor system gain changes.
Beam Reach will be working with SMRU this winter to acquire acoustic data from the Reson hydrophone system with which we can estimate noise exposure at the southern study site.
With additional support we plan to generate statistical summaries of both acoustic data sets (north and southern sites), including SRKW-specific metrics on time scales that are relevant to SRKW biology. Ultimately we will estimate the underwater sound pressure levels received when the whales were observed visually, and integrate them with information about the numbers and spatial distribution of vessels (ships from the AIS data; ships and boats from the visual observations).
AIS (ship tracking) data
Beam Reach received and logged AIS data throughout the slow-down using a VHF antenna located at the northern study site. The AIS data captured a total of 894 unique ships making 1341 individual transits of Haro Strait. For all AIS-equipped vessels that transited Haro Strait, the mean speed over ground (not through the water) was 9.1 +/- 6.9 knots and 60% had a speed over ground that was less than or equal to 11 knots. We have generated compliance statistics based on the raw AIS speeds (speed over ground), but before reporting them will also generate compliance statistics based on estimated speed through the water (speed over ground corrected with tidal current speed modeled at Kellett Bluff) to allow meaningful comparison with the preliminary compliance rates reported by the ECHO program.
One thought on “Synopsis of raw data: behavioral, acoustic, & AIS (ship tracking)”